How-to Visualize 17000 Data Points of Upload and Download Times
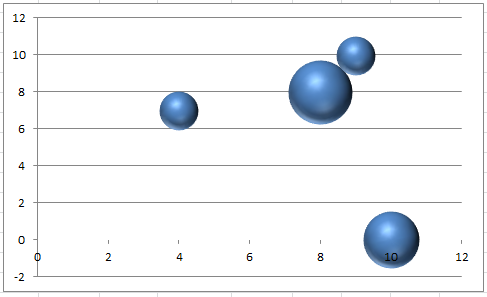
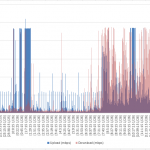
In the last Friday Challenge, I presented you with 17,000+ data points representing 2 days of network data usage.
With so many data points, it...
Friday Challenge – AverageIf NOT Blank or NOT Zero – NOT So Easy
As an Excel dashboard engineer you will often need to create complex calculations for your charts, tables and displays. So today's challenge is one...
Friday Challenge – How Would You Chart It?
Today the ExcelDashboardTemplate.com Friday Challenge is up to you and your wildest imagination.
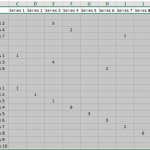
An Excel chart newbie posted this data set and wasn’t sure the...
Friday Challenge – Make an Excel Movie Database Dashboard
Movie fans are going to love this one. Today, I present to you a full Excel Dashboard challenge.
I am big movie fan. Seen tons...
Friday Challenge – Which Chart is suitable?
I am so glad it is Friday, aren’t you? There is no right answer to today’s challenge. So make sure you leave me a...
How-to Close the Gaps Between Chart Series in an Excel Stacked Clustered Column Chart
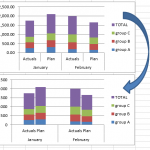
Many users like to create a chart that Excel doesn’t have as a chart type. It is a combination of a clustered column and...
Friday Challenge – Analyzing Attendance Records with Charts and Trend Line
For this Friday Challenge, lets see if we can help this user with their data.
Read it over, but really, the last line of the...
Class Exam Grade Excel Chart Using Slicers and a Pivot Table
Here is Don’s amazing reply to the recent Friday challenge.In this example, Don has elevated his Excel Slicer Pivot Charting to a whole new...
Friday Challenge – Find Unique Class List in Excel ANSWER
On Friday, I posted this challenge:
https://www.exceldashboardtemplates.com/friday-challenge-find-unique-list-in-excel/
You can download the sample data set here: Challenge Sample Data
Check out the post and download / try it yourself before you...
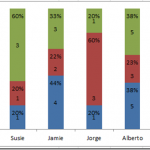
Friday Challenge – Create a Percentage (%) and Value Label within 100% Stacked Chart?
First I want to say I am sorry to those waiting to see the dynamic chart scroll bar tutorial. My project launched this week...

