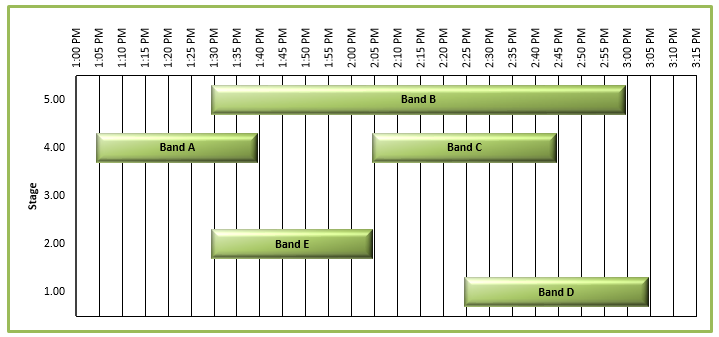
In our last Friday Challenge, we wanted to see if you can make a Music Festival Schedule in an Excel Chart.
There were 2 questions. 1) Make a chart using Conditional Formatting and 2) Make a Gantt Chart with an Excel Stacked Column Chart.
Don came up with his answer to the Gantt Chart type question.
It works pretty well and I like the 3D shading. Only change I would make is to add code to change the Min/Max based on the schedules entered in case the first band starts earlier than the fixed min/max values.
Here are the instructions:
A) Works with Excel 2013 only.
I think this is related to the Chart Labels coming from a range on the worksheet. You can check out a post about this technique in Excel 2013 here:
Excel 2013 Data Labels on a Worksheet Range
There are addins that you can get for earlier versions of Excel and you can also do it with a more manual process the first time. You can read about that option here:
Custom Dynamic Chart Labels
B) Yellow cells are inputs
C) After any changes to inputs, click the blue “Reset Chart” button.
I am not a VBA macro expert, but this looks like Don is sorting the values of the data input area so that his data labels appear on the right bar.
This chart is using a Gantt Chart format. You can read more about this technique here:
How-to make a basic Gantt Chart in Excel
24 Hour Excel Gantt Chart
Check out Don’s awesome creation here:
Dons-Music-Festival-Schedule-gantt-like-Updated.xlsm
Thanks so much for your submission Don!
Steve=True


