How-to Easily Sum Across Excel Worksheet Tabs (Plus Friday Challenge)
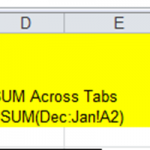
Sum Excel Worksheets Technique
Why haven't I known about this simple Excel technique before now?
Maybe you were aware how you can easily Sum Excel Worksheets...
Friday Challenge Answer – Find Unique Values from CSV List
Here is how you can quickly solve the most recent Friday Challenge: Find Unique Values from CSV List
Before we begin, I am going to show...
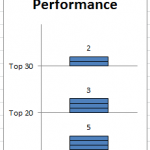
Friday Challenge – Recreate this WSJ Chart
I thought I would give you all something to do before we finish the final posting on Excel Chart Sheets.
So I have been traveling...
How-to Make a Pass Fail Chart in Excel
Last week, I posed a Friday Challenge that was posted in a Q&A for Excel. Here it is:
*****************************************************************
Plotting a line graph to track build...
Friday Challenge – Data Transformation
This weekend starts the ModelOff competition.
"ModelOff is the world’s largest professional competition for Microsoft Excel, Financial Analysis, Investment Analysis and Financial Modelling." -Modeloff Site
If...
Friday Challenge – How Would You Chart It?
Today the ExcelDashboardTemplate.com Friday Challenge is up to you and your wildest imagination.
An Excel chart newbie posted this data set and wasn’t sure the...
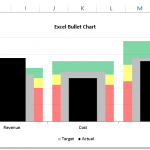
Friday Challenge – Recreate Pete’s Bullet Chart
Our good friend Pete sent me his take on the Recent Bullet Chart posting. I was dumb founded on how he created it. In...
Friday Challenge – Stacked Bar With Distribution Within a Given Range
Hello everyone. Sorry, that I haven’t presented the solution to last Friday’s challenge yet, but I have been a bit under the weather and...
Friday Challenge – Splitting Up Email Address Text with Excel Formulas
Alright, this challenge was posted by a fan in on my Youtube Channel. It was posted for this video: “Splitting Cell Text and Numbers...
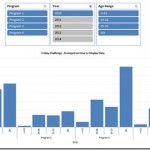
Petes Stumped Chart Challenge Answer – Pivot Chart with Slicers
In the last Friday Challenge, we were going to see if we could help a user create a chart from this data set. They...


