Advanced Excel Summation Skills Using SUMIFS and SUMPRODUCT
In this post, I will show you 2 other techniques that you can use to evaluate criteria and then create a sum of data...
Friday Challenge Answers: Year over Year Chart Comparisons
Thanks for the submissions for the Friday Challenge.
You can get the sample data and chart request here: friday-challenge-help-new-to-excel-yoy-comparisons
Here are some other submissions:
A) In the...
Friday Challenge – Make an Excel Movie Database Dashboard
Movie fans are going to love this one. Today, I present to you a full Excel Dashboard challenge.
I am big movie fan. Seen tons...
How-to Make a Wall Street Journal (WSJ) Double Lollipop Chart in Excel
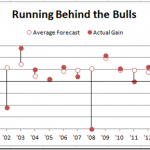
In our last Friday Challenge, I proposed making a Double Lollipop Chart seen in the Wall Street Journal (WSJ).
Here is what our final chart...
Advanced Excel Summation Techniques Using Pivot Table
There are many ways to Sum data in Excel. But when you have lots and lots of data, then you will want to learn...
Petes Stumped Chart Challenge Answer – Pivot Chart with Slicers
In the last Friday Challenge, we were going to see if we could help a user create a chart from this data set. They...
Friday Challenge – Splitting Up Email Address Text with Excel Formulas
Alright, this challenge was posted by a fan in on my Youtube Channel. It was posted for this video: “Splitting Cell Text and Numbers...
Change Chart from Amount to Percent using a Drop Down List
In case you were wondering, here is my solution to last Friday’s Excel Challenge.
Our challenge was to see if we could solve this question...
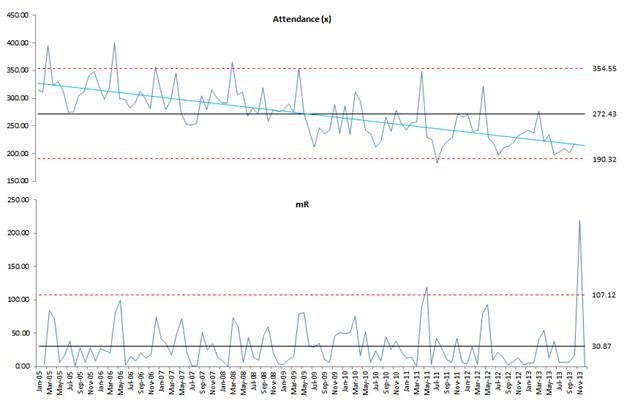
Analyzing Attendance Records with Charts and Trend Line with Sparklines
A big shout out to Don who sent in this solution to last week’s Friday Challenge: Analyzing Attendance Records with Charts and Trend Line. ...
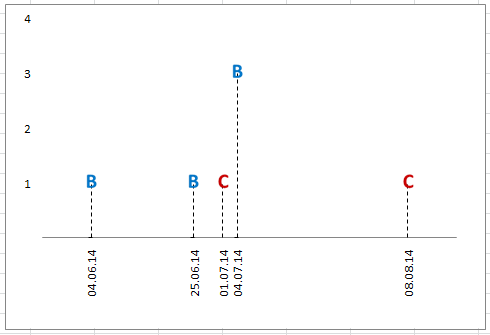
Chart Increase at Time Interval in Excel
Here is my answer to the most recent Friday Challenge. Would welcome any comments below on what you think (flaws, likes, thoughts…)
In case you...


