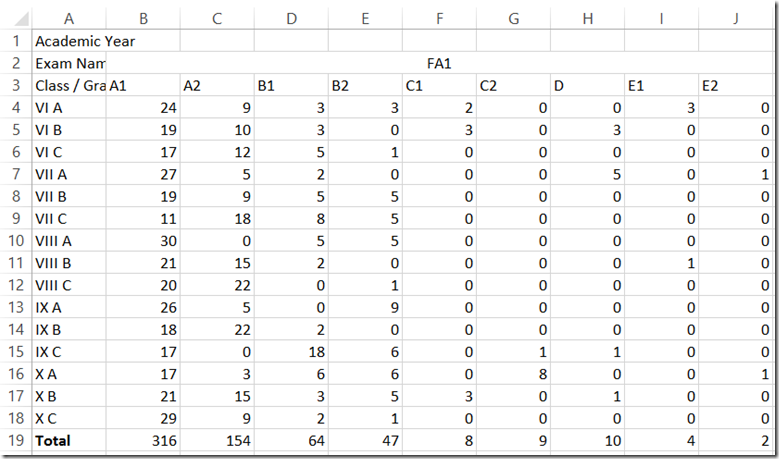
I am so glad it is Friday, aren’t you? There is no right answer to today’s challenge. So make sure you leave me a comment on what you would suggest. Also, if you want to send me your file, leave me a comment and I will send you an email where you can send it. Good luck and let me know what you think would be the right chart or graph.
Here was the request:
Which Chart is suitable
“Hello
I am confused..!Which chart I shall use for representing my data?
I need to display graph of number of students scoring grade for each Exam class wise
Mean to say – In Exam FA1 students score grade A1, A2 and so on.Now how can I display the graph for the same. I really need some guidance.
Regards “
Here is the sample data: https://www.exceldashboardtemplates.com/which-chart-is-suitable-sample-data.xlsx
Wish I could tell you more but that is all we got from the request. So put on your thinking caps and let me know how you would represent this data the best as the user wanted.
Good luck!
Steve=True


