Advanced Excel Summation Skills – Using ARRAY Formulas to Check for Multiple Criteria
In this post, I will show you another Excel summation technique that you can use to evaluate criteria and then sum the data based on that...
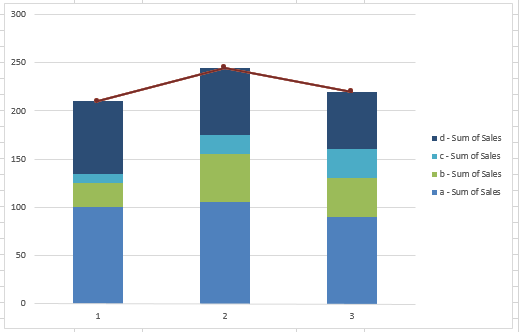
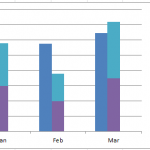
How-to Create a Stacked and Unstacked Column Chart in Excel
Stacked and Unstacked Column Chart in Excel
Excel is awesome because, even when a certain chart type is not a standard option, there may be...
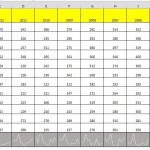
Analyzing Attendance Records with Charts and Trend Line with Sparklines
A big shout out to Don who sent in this solution to last week’s Friday Challenge: Analyzing Attendance Records with Charts and Trend Line. ...
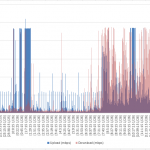
How-to Visualize 17000 Data Points of Upload and Download Times
In the last Friday Challenge, I presented you with 17,000+ data points representing 2 days of network data usage.
With so many data points, it...
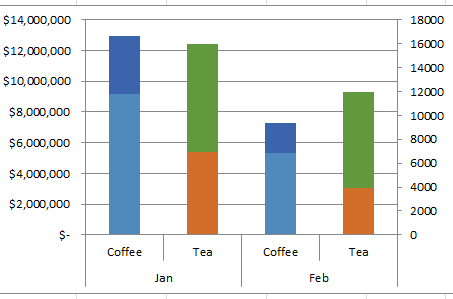
How-to Make an Excel Clustered Stacked Column Chart with Different Colors by Stack
In a popular post, I showed you how to easily create a Clustered Stacked Column chart in Excel using Multi-Level Category Axis options.
Here is...
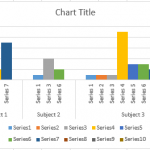
Removing Gaps in an Excel Clustered Column or Bar Chart (Part 2)
Removing Gaps - Excel Clustered Column or Bar Chart (Part 2)
In an earlier Friday Challenge, I posted a problem where someone wanted to remove...
How-to Make an Excel Chart with 3 Different Column Widths (Bullet Chart Option 2)
In are recent post, I showed you how to create a Bullet Chart in Excel. Pete, then sent me another way to create a...

