Case Study – Creating a Dynamic Chart in Excel Using Offset Formula
A YouTube video subscriber Mili, wanted to know more about creating a Dynamic Excel Column Chart using Offset function. So Mili sent me the...
How-to Make a Conditional Column Chart in Excel
As you build your Microsoft Excel dashboards, you may want to highlight your data points that exceed your Key Performance Indicators (KPIs) as well...
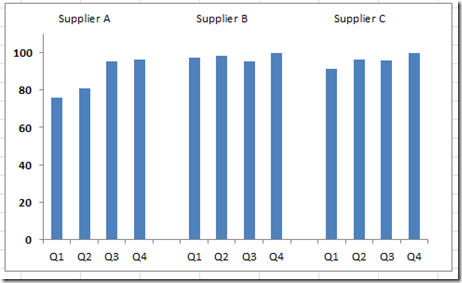
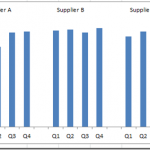
How-to Create an Excel Dashboard Column Chart with 2 Axis Groupings
Recently I saw this in the MrExcel Forums. The title “Weird Charts with 3 Axis” intrigued me.
I determined that they were looking to put...
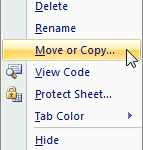
How-to Copy Charts and Change References to New Worksheet
Have you ever made a great chart for your Excel Dashboard and you wanted to reuse it for another set of data? Perhaps you...
Steve Williams Caddie Earnings After Tiger Woods Split – Mini Dashboard
Now, you may know that I am a PGA Tour Golf fan and you may also know that Tiger Woods has been doing very...
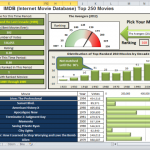
Excel Dashboard of the Top 250 Movies – Don’s Friday Challenge Entry
Here is our next submission from the last Friday Challenge for the Internet Movie Database Top 250.
Below you can download an awesome Excel Dashboard...
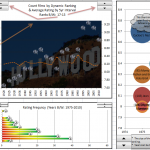
Top Movies – Excel Dashboard – Brian’s Friday Challenge Entry
This was our final entry in the most recent Friday Challenge for the Internet Movie Database Top 250.
Below you can download an awesome Excel...
Dashboards are Everywhere!
Dashboards Can Be Found Everywhere
I am presently in Suzhou China working on a new project and I decided to go to the gymnasium. I...
How-to Make an Excel Chart Title Change Dynamically
Have you ever wanted to change your chart title dynamically?
Perhaps you wanted to link it to a cell value?
Did you know that it...
Excel VLOOKUP–Left or Right and HLOOKUP Up or Down
Better late than never to the VLOOKUP week as started by Mr. Excel, Bill Jelen.
I have never been a big fan of the Excel...

