Have you ever made a great chart for your Excel Dashboard and you wanted to reuse it for another set of data? Perhaps you want to recreate the chart for a new year or another company or another division. What an easy way to do this without having to change each and every series to the new data range?
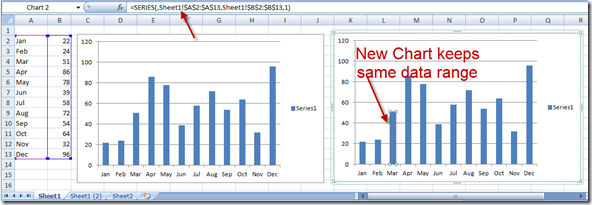
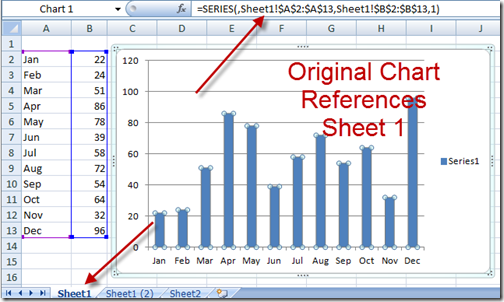
This is a very common need for most Excel users. So what do most Excel Beginners do? They copy the chart/graph and paste it in the current worksheet or perhaps on another worksheet. However the chart retains the same chart range. That means that if you change the data for the original chart, both charts will change and look exactly alike. This doesn’t help us with what we want to do. Since the new chart still references the original data range, we will have to change each chart series reference in order to reuse the same chart with a new data range.
The Breakdown
Let’s see how to do this to quickly recreate our Excel dashboard charts:
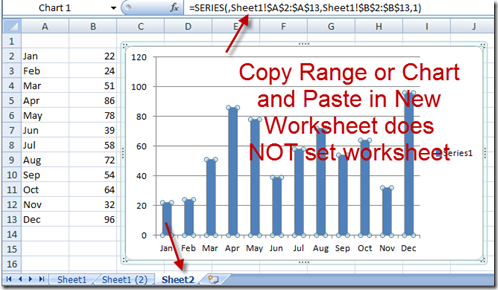
In order to copy the chart and make it reference another worksheet, we must make a copy the Worksheet from the Worksheet tab. This will not work if you just copy the range of data including the chart. It must be done by copying the entire worksheet.
HOW-TO
1) Right Click on the sheet where the original chart and data series are stored.
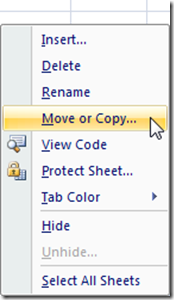
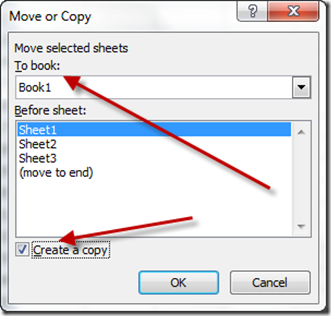
2) Click on Move or Copy…
3) Check the “Create a copy” checkbox. If you want to make a similar chart in another workbook, change the “To book:” to the other workbook that you want this Excel Dashboard Chart to be copied.
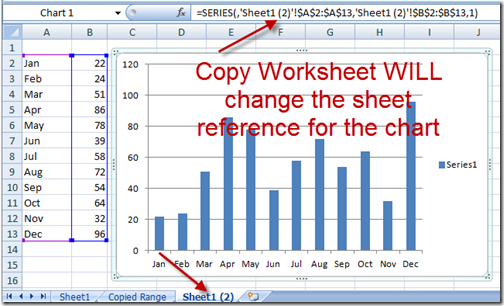
4) Click on the OK button and see the Resulting Excel Chart with the new Excel reference range:
Video Tutorial
Hopefully this will save you lots of time in making your Excel Dashboards. Now you don’t have to change each and every chart series to a new data range.
Steve=True

