How-to Create a Combo Line and Column Pivot Chart

Some Excel users can be confused when it comes to Pivot Tables and Pivot Charts.  I recently saw a post asking for this help:

“Please advise if it is possible to combine a pivot line graph and a pivot stacked column graph into one graph?”

Maybe you have this problem as well.  Here is how to quickly create a Combo Line Column Chart in Excel

1) Create your Pivot Chart

Click in the Pivot Table and then go to the Insert Ribbon and click on the Column Chart type:


Insert Excel Pivot Chart

Then select the data series that you want to change into a Line Chart Type:

If you can’t select the right data series, try a tip or trick from this post to help:

how-to-select-data-series-in-an-excel-chart-when-they-are-un-selectable

Select Excel Chart Data Series

Then navigate to the Design Ribbon and click on the Change Chart Type button:

Chart Tools Change Chart Type

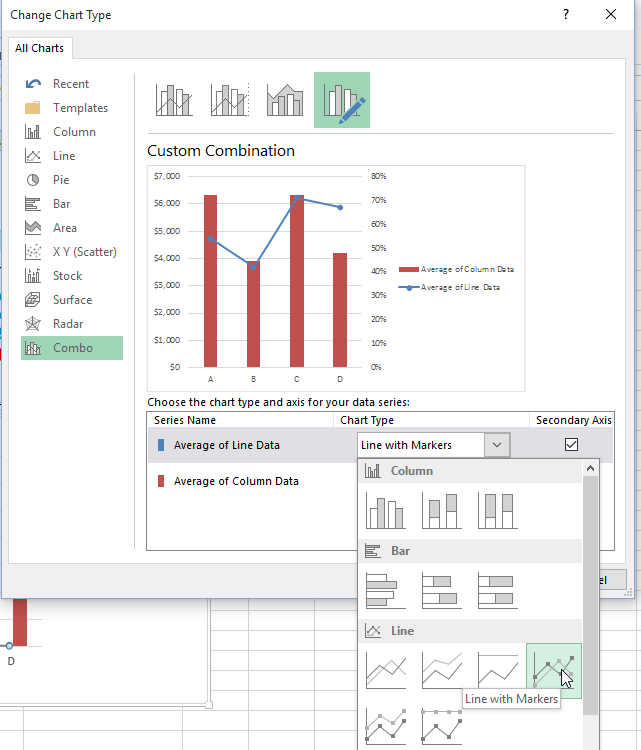
In Excel 2013, you will be able to change the chart type of each series as well as move the ones you want to the secondary axis.

Combo Line Column Chart


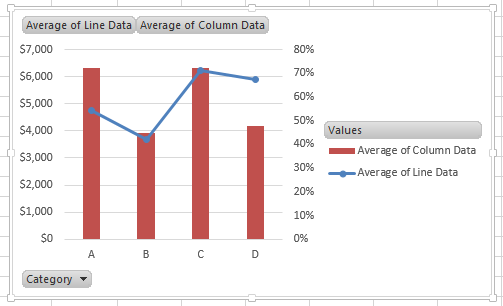
You will then have the Combo Pivot Chart you desire:

Combo Line Column Chart 2


Video Tutorial


If you found the website and tutorials helpful, please consider donating to keep the lights on.

Donate with PayPal here:


Sample Excel Chart File

Combo-Line-and-Column-Excel-Pivot-Chart-Sample1.xlsx


Steve=True


4 COMMENTS

  1. Thanks for video. And I would like to ask the way to move secondary axis of each point sit in
    primary column end position, not in the middle. I tried many ways but not succeed.
    The video show only secondary each point at the middle of column point.

    • Hi Myo Ko Ko, I believe I understand what you mean. Sorry, you cannot do that with a line chart. Line Charts only plot to the middle of the category. Perhaps you can do it with a XY chart. I will have to try it 🙂 Steve=True

  2. Hi

    Can the same be achieved using excel 2010 as I do not have the option of combined chart type.

    Is it possible to combine the Bar graph and Line graph when the Bar Chart is on a different spreadsheet (for example: measuring Import Profits) and a Line graph on another separate spreadsheet (For Example: Measuring Export Sales)?

    • Hi Celeste, since it is a pivot chart, your data has to be in the pivot table. So I would assume if you can get your data into the pivot table and thus the pivot chart then you would be able to do this. Steve=True

LEAVE A REPLY

Please enter your comment!
Please enter your name here