How-to Fix Sales Goal Error of Excel Thermometer Chart
I have to admit that I messed up and presented a broken solution for the Excel Sales Goal Thermometer Chart.
The error was presented in this previous post. If you don’t remember it, please check it out with the link below:
Challenge for you: Download the chart and try and fix it first before looking at the answer below. After you try the challenge, let me know in the comments below if you succeeded in a fix and if it was the same as mine.
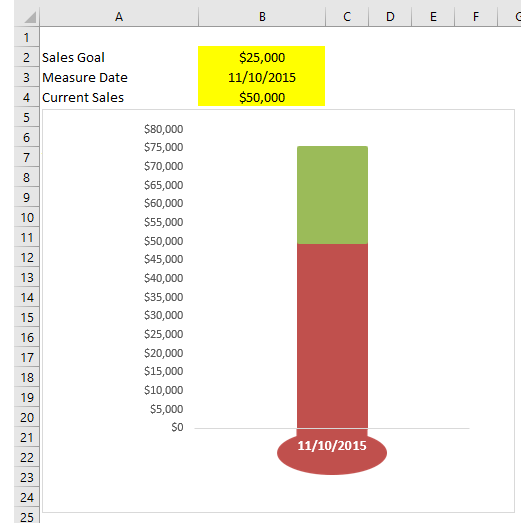
Now the chart looks great, but it FAILS when you perform full User Acceptance Testing. What is the error you may ask? It happens when you beat your sales goal. It keeps adding both the goal and current sales achieved to infinity.
Here is a sample of what happens when you have a goal of 25,000 and your current sales are at 50,000. Notice that the Vertical Axis and values of the stacked column chart
It is simple to correct.. See the details below and also check out the very very short video that shows the Thermometer Chart fix.
The Breakdown
1) Add Data Point Series Formula
2) Change Data Point to Chart
Step-by-Step
1) Add Data Point Series Formula
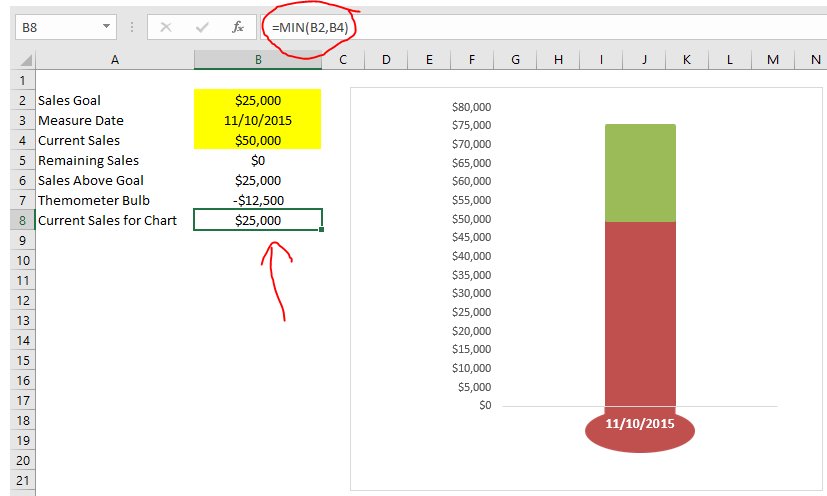
For the fix, you will need to add a new formula that finds the Min between the Goal and Current Sales to plot the column of the Thermometer Chart.
Go to Cell B8 and enter in this formula:
=MIN(B2,B4). This will make sure that the base column never goes above the goal.
2) Change Data Point to Chart
Now that you have the data point we need for the Thermometer Chart, we just need to change the chart reference from B4 to B8. One easy way to do that is to select your chart, then select the red series 1 that is just above your Thermometer bulb at the bottom.
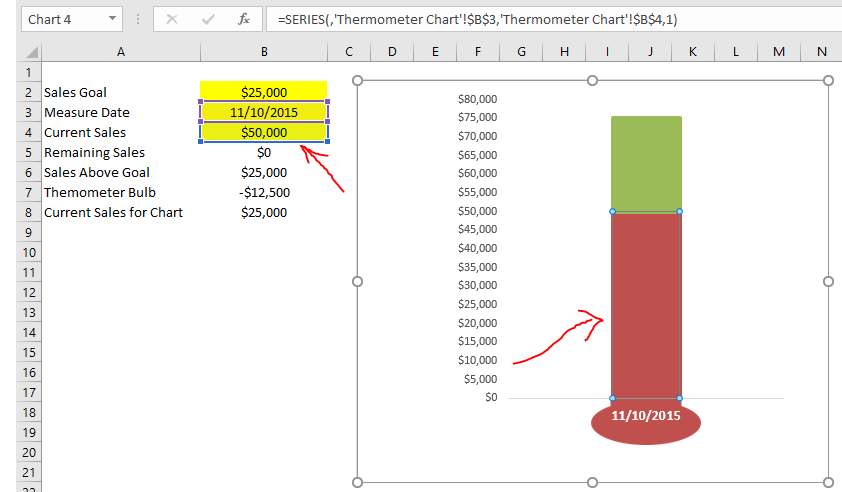
Then drag it and drop it cell B8 (where we created the MIN formula) as you see here:
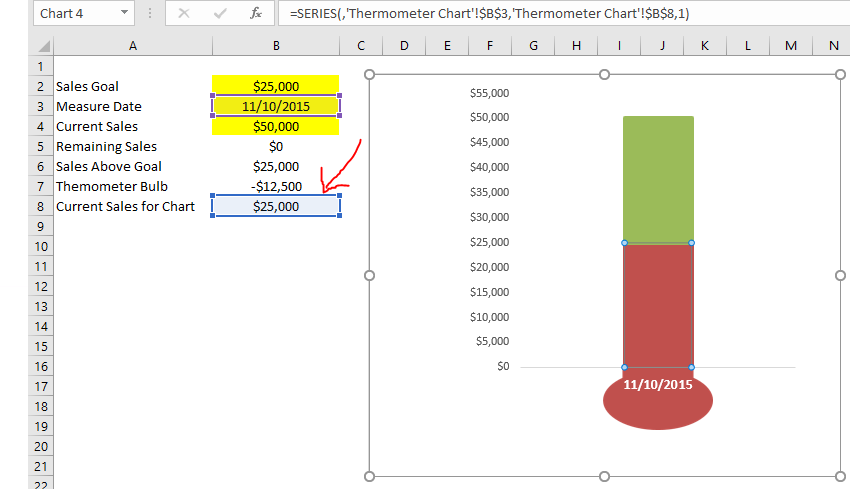
As soon as you drop it, the Thermometer Goal Chart is fixed as you see above.
Remember to test, Test, TEST! your Excel development as much as possible. I should have caught this problem.
Video Demonstration
Check out this Video tutorial on the techniques presented above.
Sample File Download
Click here to Download the Free Sample Excel Template File:
Fix-Error-Current-Sales-Greater-than-Sales-Goal-Thermometer-Chart-in-Excel.xlsx
But the fix was easy enough if you give it a little thought. Did you take the challenge and pass or fail? Did you fix it differently than my solution? Let me know in the comments below.
Steve=True


