Hi ExcelDashboardTemplate Fans!
Today is a challenge on a challenge.
Previously I posted a data set that and asked you to create your own chart of the data. Please check it out here and download the sample file so that you can try your hand at today’s challenge.
Pete and Don submitted some great dynamic charts. You can see what they did here:
Friday Challenge Answer – Using Excel Slicers to Create Dynamic Charts
Friday Challenge Answer – Dynamic Excel Chart Using Checkboxes for Multi Year by Month Data
So today’s challenge is a take on the same data, but the challenge is to see if you can replicate my solution before I show you how I did it.
Here is what you need to do:
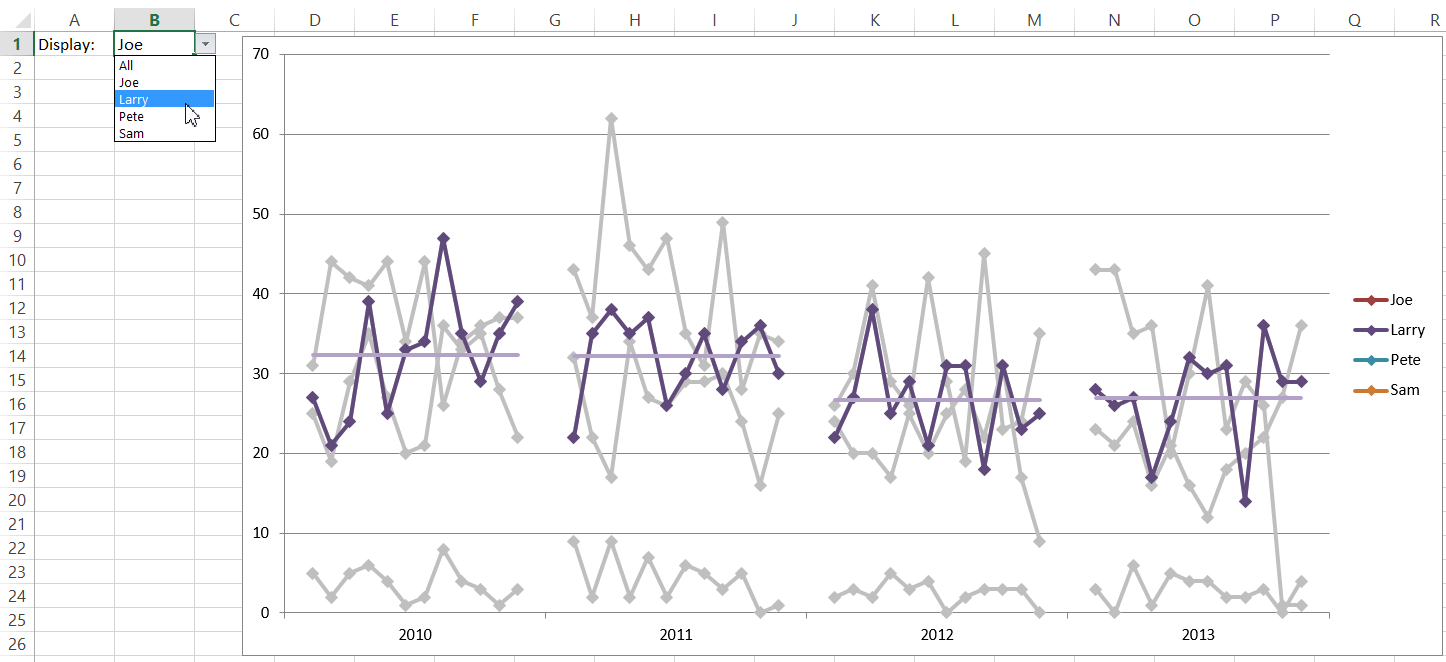
1) Create a chart that replicates my Multi-Year with Year 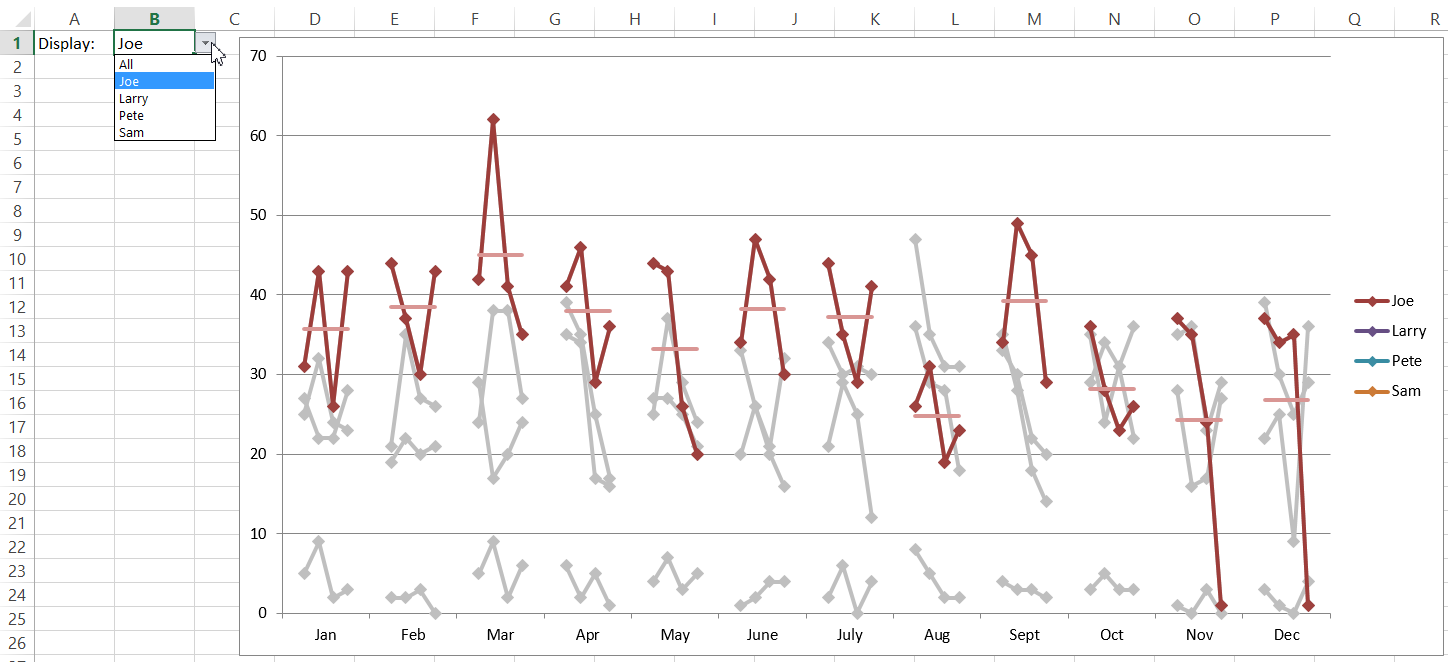
Data By Month. This can be the tough part. Here is what it will look like:
2) Make it Dynamic with a pick list that either shows all lines or where you can choose one person and highlight their line while greying out the other lines
Here is a cool tutorial that will show you how to conditionally change the color of a data series:
3) EXTRA Credit: See if you can do the same thing by turning the data on its end and have Month within each Year like you see here:
Here is a very quick video showing you my solution in action:
Good luck and leave me a comment with your email in the email field so that I can shoot you a note so you can send me your file. Thanks
Steve=True


