The Easiest Way to Copy An Excel Worksheet – (With Only One Click)
Frequently when working in Excel, I will need to copy an entire worksheet.
Copying an entire worksheet is particularly helpful when you are need to...
Incredible Excel 2012 Olympic Medal Count Dynamic and Interactive Dashboard
People are awesome and so creative. We have been talking about building an Olympic Medal Count Dashboard using Excel and I asked for your...
The Absolute Quickest Ways to Make a New Chart in an Excel Spreadsheet
When creating my Microsoft Excel Dashboard Templates, I frequently create a chart to see how it would look and I don’t always keep them. ...
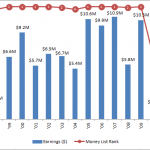
How-to Create an Excel Combined Chart for Tiger Woods Earning and Money Rank
Check out this Excel Combined Chart on how much money has Tiger Woods made over his career and also how did he rank in...
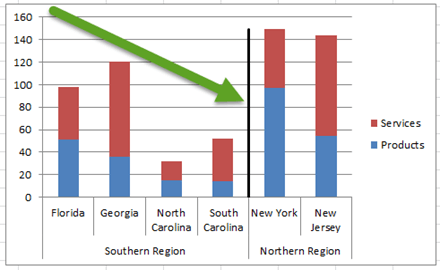
3 Ways to Create Vertical Lines in an Excel Line Chart
Sorry I have been swamped on a new project in Australia and Singapore so my posts have been less frequent than I wish. We...
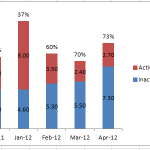
How-to Put Percentage Labels on Top of a Stacked Column Chart
There are times when you are creating your Excel Dashboard Design that you desire something that does not come naturally with the Excel Tools...
How-to Select Data Series in an Excel Chart when they are Un-selectable?
When I first learned to make Excel charts, I was taught to select the chart and then select the data series with my mouse. ...
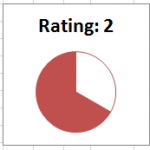
Make a Pie Chart Rating for Excel Dashboard Chart Templates
In a recent forum post, a dashboard user was asking how they can turn a decimal like 1.5 out of a 3.0 possible into...
How-to Add Custom Labels that Dynamically Change in Excel Charts
Have you ever wanted to have a different data point label in your Excel Chart than what is offered by the Standard Excel Dialog...
How-to Plot Building Wall UR Value in an Excel XY Scatter Chart
In an Excel Help Forum, an engineer wanted to know how to chart the following data:
The data would need to be plotted like on...

