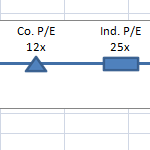
Company and Industry P/E (Price to Earnings) Line Chart – 2 Ways
Here is a fun and easy Dynamic Excel Chart that you can use in your Excel Dashboard Template.
This Excel Chart has many financial research,...
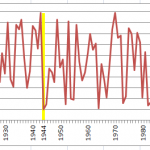
How-to Show Decades and Highlight a Year in the Horizontal Axis
Recently in an Excel Forum, a user had data similar to this format:
Here is what he wanted to do:
How do I set the Horizontal...
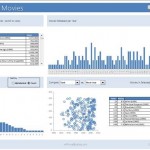
IMDB Top 250 Movies of All Time – Excel Dashboard Tutorial
In our last Friday Challenge, we presented a data set of the Top 250 Movies from IMDB and asked you to create a dashboard...
Welcome to the New Microsoft Excel Dashboard Templates Blog where you will learn how...
This is my new blog dedicated to helping you learn and make your own Dynamic Microsoft Excel Executive Dashboard Templates and Charts.
I have many...
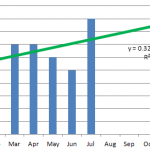
How-to Format Trend Line Color in Excel Dynamically
Many users use Trend Lines in Excel charts and graphs. They may also be used in Company Dashboards, but to you can make your...
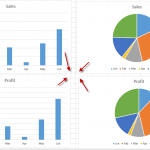
How-to Line Up Your Excel Worksheet Embedded Charts
Have you ever created a lot of charts in an Excel Worksheet and drove yourself crazy trying to line the charts up?
Notice how the...
Step-by-Step Tutorial: How-to: Make a Company and Industry P/E (Price to Earnings) Line Chart
In my last post I showed the concepts of making a P/E (Price-to-Earnings) Excel Chart for your Dashboard Template. In this post I will...
How-to Make a Company Goal Chart or IPAD Battery Chart in Excel
I was looking at my IPod Touch and I really liked the battery graphic that is shown. Then I looked at my IPhone and...
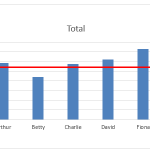
3 Ways to Add a Target Line to an Excel Pivot Chart
Add a Target Line to an Excel Pivot Chart
Many Excel users use Pivot Tables and they find it very easy to create a Pivot...
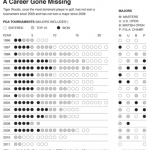
Tiger Woods PGA Tour and Major Championship Chart
I am a fan of the PGA and Tiger Woods. So I was really excited when I saw this post from Paresh Shah of...

