Last week a user in the Mr. Excel Forum wanted to know how to make a vertical line chart where the horizontal categories are displayed vertically and then also wanted the vertical axis numbers to appear on the top of the chart. In this post I will show you how to use the Camera Tool in Excel to create this type of graph for your Excel Dashboard.
What is the Camera Tool?
The Camera Tool will help you to display a Dynamic graphic object of a cell or range of cells. So if you highlight a range of cells that contain a chart or graph, Excel will show this range of cells with the chart as a dynamic picture link that can be used throughout the spreadsheet as an object. This object can be flipped, stretched and rotated like any other Excel object. There is one drawback in using the Camera Tool that may hinder your use of it and that is it that the Camera Tool objects may have a reduced resolution from the actual chart. Sometimes it may look grainy or pixelated.
Where do I find the Camera Tool and How do I use it?
Here is what Excel 2007 Help shows for the Camera Tool. Looks like it is only available from the Quick Access Toolbar, so you won’t find it in any Excel Ribbon. This is probably why most people don’t know about it.
Dynamically display cell range contents in a picture
If you haven’t already done so, add Camera to the Quick Access Toolbar.
Click the arrow next to the toolbar, and then click More Commands.
Under Choose commands from, select All Commands.
In the list, select Camera, click Add, and then click OK.
Select the range of cells.
On the Quick Access Toolbar, click Camera.
Click a location on a worksheet or chart where you want the picture of the cell range inserted.
The contents of the cell range is displayed in the picture.
-
To format the picture or do other operations, right click the picture and choose a command.
For example, you may want to click the Format Picture command to change the border or make the background transparent.
So how do I make a Vertical Line Chart with the Camera Tool?
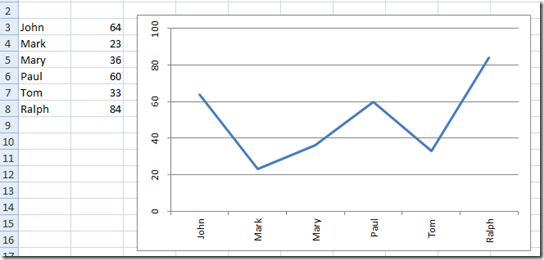
1) Create your line chart
2) Flip the Alignment of your Chart Axis to 270 Degrees. You will need to do this so that the axis labels will be readable when we flip the chart.
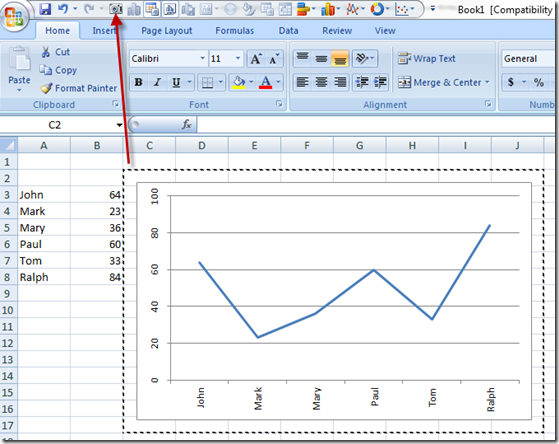
3) Highlight a range of cells that include the Line Chart:
4) Click on the Camera Tool from your Quick Access Toolbar.
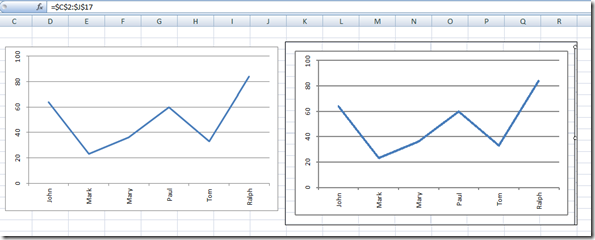
5) Click on any other cell and your Camera Object will be created with the Dynamic Picture Link of the cells selected.
6) Select your Camera Object and Grab the Green Rotate control on the top, then drag the object to the right to rotate the Excel Chart.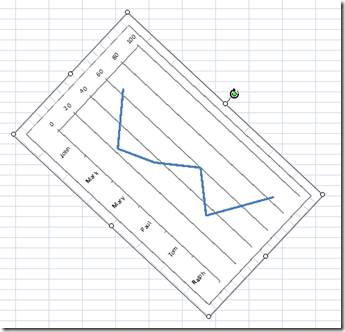 7) Drop the Rotate Control at 90 degrees to create the Vertical Line Chart.
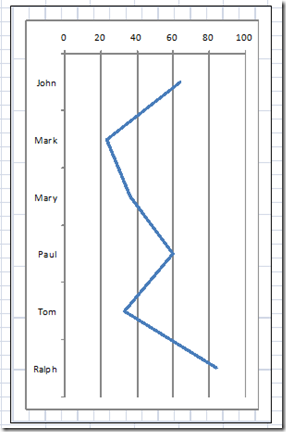 There now you can create a Vertical Line Chart. However…..
USE THIS VERTICAL LINE CHART WITH CAUTION!!!
This is a very deceiving and confusing chart to me. Although you can make this chart using Excel Camera Tool, I would suggesting using a Horizontal Bar Chart.
Update: I have developed another way to make this chart without the Camera a tool. It is called a Likert Chart. I haven’t verified this but I think it may also be called a Value Chart. Here is the post, video and tutorial:
how-to-make-an-excel-vertical-likert-line-chart-with-categories
Hope this help!
Steve=True

