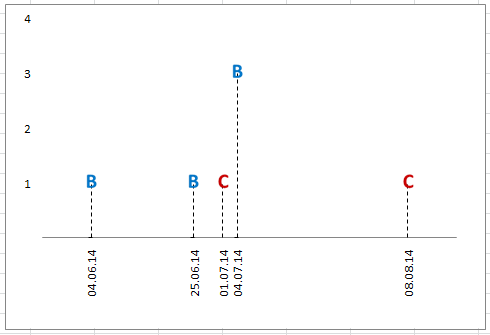
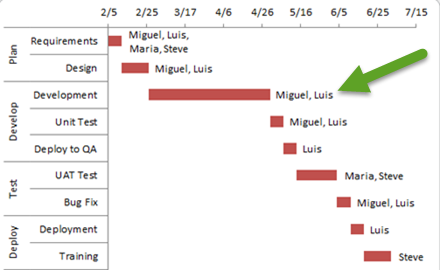
Presenting Metrics Data – How would you create a chart for this data?
In my last post I asked how you would create a chart for this request:
Presenting Metrics Data
Trying to find the best way to...
How-to Make a Sales Pipeline Funnel Excel Chart Template
You probably have seen this type of Funnel Chart in Business Intelligence (BI) software packages and wondered how-to make this type of chart in...
How-to Select Data Series in an Excel Chart when they are Un-selectable?
When I first learned to make Excel charts, I was taught to select the chart and then select the data series with my mouse. ...
Remove Excel Chart Whitespace from Empty or Zero Columns (Part 1)
Hi everyone. In the last Friday challenge, we had a user post this question about an Excel Column Chart:
Chart: Remove whitespace from empty (non-existent)...
Friday Challenge: Can the data in chart change itself to be percentages & number?
Hi Excel Fans!
Today we are going to see if we can solve this question from Ajay.
Ajay wrote:
Can the data in chart change itself to...
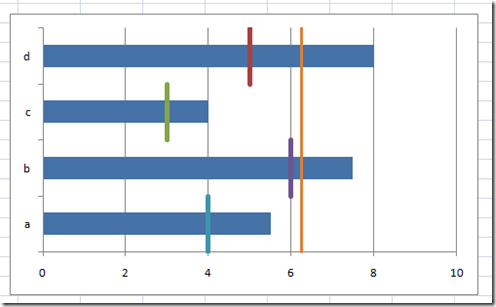
How-to Add Lines in an Excel Clustered Stacked Column Chart
I have posted several Excel chart samples related to Clustered Stacked Column Charts.
In case you missed them, you can check them out here: Excel...
How-to Add a Line to an Excel Chart Data Table and Not to the...
Many people making Excel charts love to add a Chart Data Table to their graph. However, the Excel Data Tables are not very flexible...
Friday Challenge – Close the Distance Between a Clustered Stacked column Chart
For this week’s challenge, we are going to modify a previous post for a user request.
If you are not familiar with it, you should...
How-to Make an Excel Vertical Likert Line Chart with Categories
In the Mr. Excel forums there was a question raised on how can you create a Likert Chart or Graph using Excel. The person...
Steve Williams Caddie Earnings After Tiger Woods Split – Mini Dashboard
Now, you may know that I am a PGA Tour Golf fan and you may also know that Tiger Woods has been doing very...


