Tag: Dynamic Excel Chart
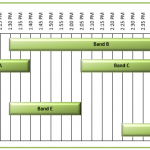
Don’s Macro Enabled Friday Challenge Answer – Music Festival Schedule Excel Chart
In our last Friday Challenge, we wanted to see if you can make a Music Festival Schedule in an Excel Chart.
There were 2 questions. ...
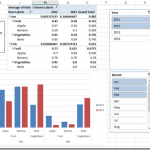
How-to Create a Dynamic Excel Pivot Table Dashboard Chart
In my last 2 posts:
I showed you how to setup your data in preparation for creating a dynamic dashboard chart
Part 1: think-like-a-database-designer-before-creating-an-excel-dashboard-chart
And then I...
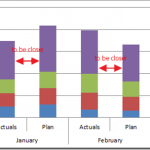
Friday Challenge – Close the Distance Between a Clustered Stacked column Chart
For this week’s challenge, we are going to modify a previous post for a user request.
If you are not familiar with it, you should...
How-to Create a Scroll Bar in Excel to Make Your Dashboard Dynamic
This is part 1 of creating a dynamic Excel dashboard chart using the scroll bar control.
So in the title I said that we would...
How-to Make a Picklist Change the Chart Type for a Dynamic Excel Dashboard
Have you ever wanted to create a graph but then let users dynamically change the Excel chart type with a drop down pick list? ...
How-to Create a Dynamic Banding on an Excel Line Chart
This dynamic shading or banding chart is frequently used in science and in Company Dashboards. It allows the user to quickly see if their...
Create a Dynamic Excel Pie Chart
How-to Create a Dynamic Excel Pie Chart Using the Offset Function
Recently, I viewed a forum post where a user wanted to create a dynamic...
Case Study – Creating a Dynamic Chart in Excel Using Offset Formula
A YouTube video subscriber Mili, wanted to know more about creating a Dynamic Excel Column Chart using Offset function. So Mili sent me the...
Make a Pie Chart Rating for Excel Dashboard Chart Templates
In a recent forum post, a dashboard user was asking how they can turn a decimal like 1.5 out of a 3.0 possible into...
How-to Plot Building Wall UR Value in an Excel XY Scatter Chart
In an Excel Help Forum, an engineer wanted to know how to chart the following data:
The data would need to be plotted like on...

