Tag: Graph
Halloween Special – Spider Web, Spider and the Fly Chart
In honor of Halloween I thought I would post something fun. For those that are not in the USA, Halloween is where children dress...
Dashboard Chart of Tiger Wood’s Money Ranking List and Golf Earnings
With the upcoming Open Championship (also known as the British Open) in Royal Lytham & St. Annes Golf Club, I wanted to see how...
How-to Make and Add Custom Markers in Excel Dashboard Charts
When is a picture worth a thousand words? Definitely when you use custom markers in your Excel Charts.
This will make your Excel Dashboard Charts...
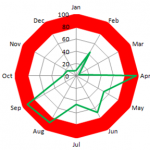
How-to Highlight or Color Rings in an Excel Radar Chart
Recently a user in an Excel Forum wanted to know if there was any way to highlight or color the outside ring of an...
How-to Make a Horizontal Tornado Chart Comparison
Recently in an Excel Forum, a user was asked to create a chart that compared 4 companies by month in a Column Chart.
HOWEVER, there...
Free Dashboard Template Download – BMI Weight Tracker
In this ever expanding universe, so is my belt. I need to drop more than a few pounds.
Now I can use an Excel Dashboard...
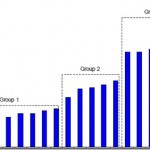
Group Column Chart with Lines for Excel Dashboard Presentations
Yesterday a user in the MrExcel.com Forums asked how he could make a Column Chart in Excel and then Group those Columns with a...
Step-by-Step Tutorial: How-to: Make a Company and Industry P/E (Price to Earnings) Line Chart
In my last post I showed the concepts of making a P/E (Price-to-Earnings) Excel Chart for your Dashboard Template. In this post I will...


