Friday Challenge: What is your answer vs. Excel?
There is a Facebook post going around and I thought it would be a fun Friday Challenge edition.
What is your answer to this this question?
Then put in the formula into Excel and see what...
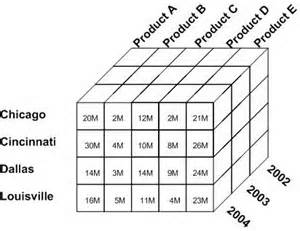
Think Like a Database Designer Before Creating an Excel Dashboard Chart
Recently, a fan asked for some help. However, when I got their file, I saw that they needed some help with basic concepts, so I thought I would share those concepts with you.
Now, let...
Better Formulas for Pipeline Matching Stacked Bar Chart Colors to Products without VBA Solution
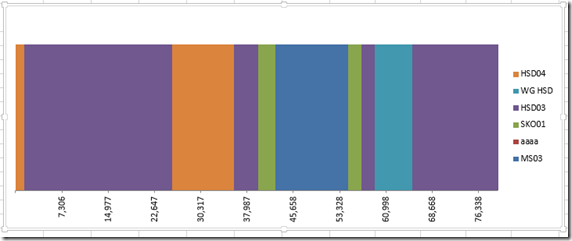
Hands off to Leonid :) for this awesome solution with much Much BETTER formulas for a recent Friday Challenge.
Here was the original Challenge:
friday-challenge-pipeline-usage-chart
Here was my solution that this post references:
pipeline-challenge-matching-stacked-bar-chart-colors-to-products-without-vba
Leonid modified the 2 formulas...
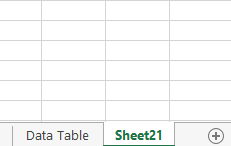
How-to Quickly Find and Jump to the Right Worksheet Tab in Your Excel Workbook
As Excel users, we may create a spreadsheet with many many many worksheets (tabs at the bottom) within the workbook. However, if you create more tabs than you can see on the bottom of...
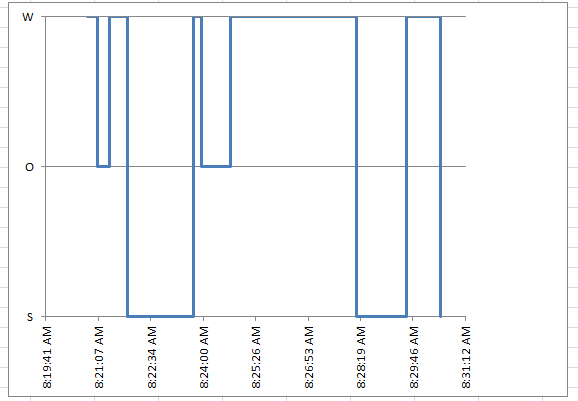
How-to Create a Time Data Series Step Chart in Excel
In our recent Friday challenge, we were asked by Anna how can we make our popular Excel Step Chart work for data that is not date based, but time based. The use case is...
Friday Challenge – Step Chart for an Excel Time Series
I was recently asked for assistance with this request:
Hi Steve,
I am trying to make a hypnogram with data that we collected over the course of a day. I want the y-axis to denote wake...
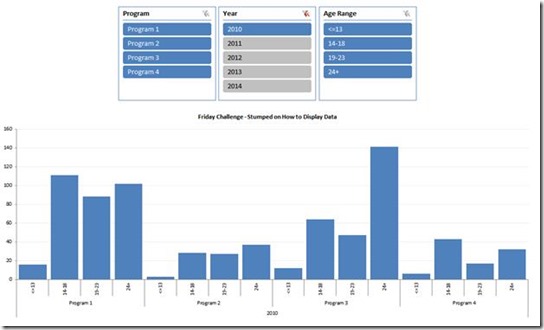
Petes Stumped Chart Challenge Answer – Pivot Chart with Slicers
In the last Friday Challenge, we were going to see if we could help a user create a chart from this data set. They were confused on what type of chart to make and...
Pipeline Challenge Matching Stacked Bar Chart Colors to Products without VBA
In our recent Friday Challenge, we were tasked with creating a Stacked Bar Chart where the colors matched the products. You can check out the challenge here:
Original Challenge: friday-challenge-pipeline-usage-chart
We had a number of great...
Friday Challenge – Stumped on How to Display Data in an Excel Chart
I had some great responses to the last Friday Challenge, so I didn't want to stop the momentum with my answer to the last challenge, so I will post that next week. So here...
Leonid’s Friday Challenge Answer – Pipeline Usage Stacked Bar Chart
Here is a late entry :) Thanks Leonid. This is an Awesome response!
Leonid was responding to this recent challenge: Friday Challenge – Pipeline Usage Chart
Leonid's Solution:
Essentially, this solution is a Clustered Column Chart. However,...


