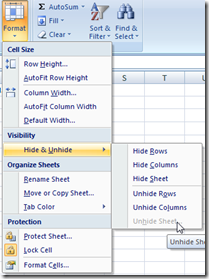
Many times when you are building your Excel Dashboard Templates, you will want to hide rows or columns in the same area as your Excel Dashboard Components. Now this may be causing you one or both of the following problems that you don’t know how to fix:
1) Your Chart is losing data or data is being hidden;
2) The size of your Chart is changing.
Since these are the default settings, it may be causing you a problem because it is not what you want it to do. Also, it may be a problem for you from time to time because Excel has done a very good job at hiding these options. Here is how to fix these issues and video tutorial to set your charts straight.
The Fix – Step-by-Step
Problem 1 – My Excel Chart is Missing Data after I Hid Rows or Columns in My Spreadsheet.
When you make your charts and graphs in Excel you base those charts on a set of data in a spreadsheet range. From time to time you may wish to hide columns or rows of this charted data. However, the standard chart setting in Excel is to hide/remove the data from Excel chart when you hide rows or columns in the spreadsheet. This can be a cool feature, but can be really annoying if you do not know how to fix it.
In order to “Show Data in Hidden Rows and Columns” you must do the following:
1) Select your chart
2) Then from the Design Ribbon, press the Select Data button from the Data group.
3) Then the Select Data Source dialog box will come up. From here you want to select the “Hidden and Empty Cells” button on the bottom left of the dialog box.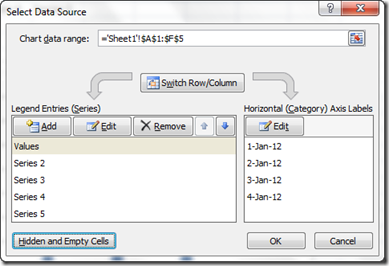
4) from the Hidden and Empty Cell Settings dialog box, you will need to check the “Show data in hidden rows and Columns check box.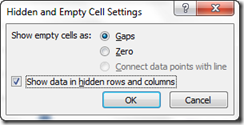
Wow, that is tough to find if you don’t know where to look. Excel did a good job at hiding this option. In my opinion, they should have made Showing Data in Hidden Rows and Columns the default and not the other way around. Oh well, now you know where this option is found and knowing is half the battle.
Problem 2 – My Excel Chart is Resizing or Moving after I Hid Rows or Columns in My Spreadsheet.
If you have your Excel Dashboard Component Charts as objects in the spreadsheet, you may want to make sure they never change size or move within the spreadsheet. However, the standard default choice is that the chart will shrink or grow in size when you hide or show rows or columns in the spreadsheet and the chart is above these columns/rows.
In order to Stop your charts from Moving or Resizing when showing/hiding rows/columns, you must do the following:
1) Select your chart
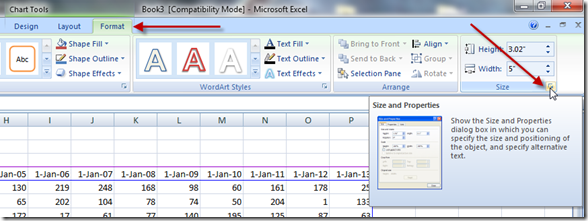
3) From the Size and Properties dialog box, you want to choose the “Don’t move or size with cells” radio button from the Properties tab as seen here: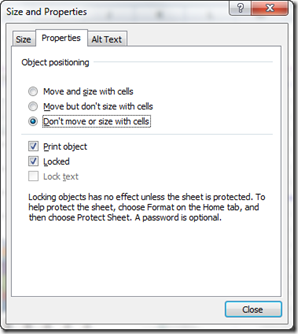
I also think that this should have been the default and the standard option of moving/sizing with cells as the option. Oh well, what do I know. Now you know how to fix this potentially frustrating problem. That that is the full battle. ![]()
Video Tutorial
What do you think the defaults should be? Let me know in the comments.
Steve=True

