A while back, I published an article on how to make an Area Cliff Chart.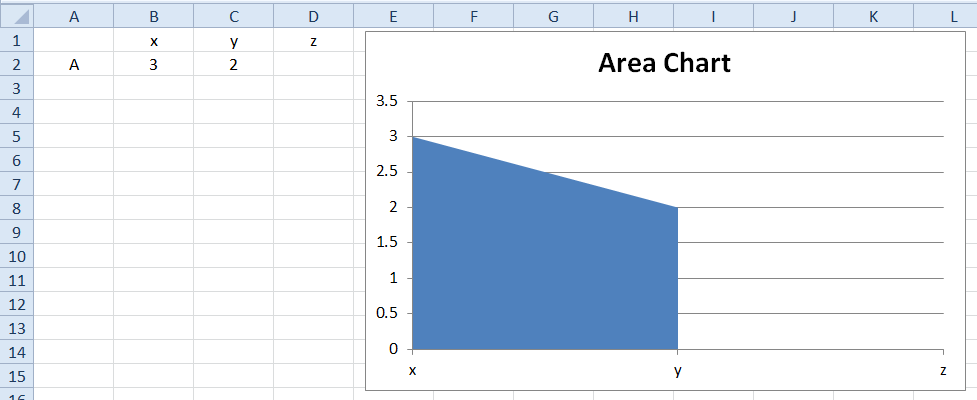
Now this isn’t a standard chart type.
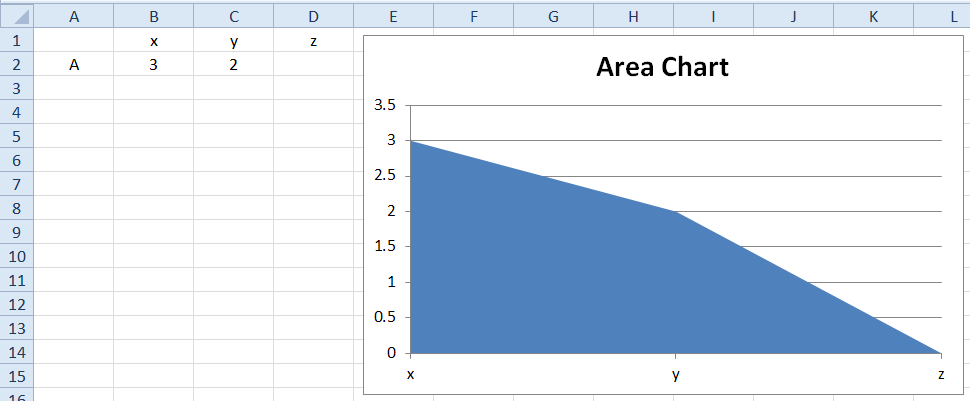
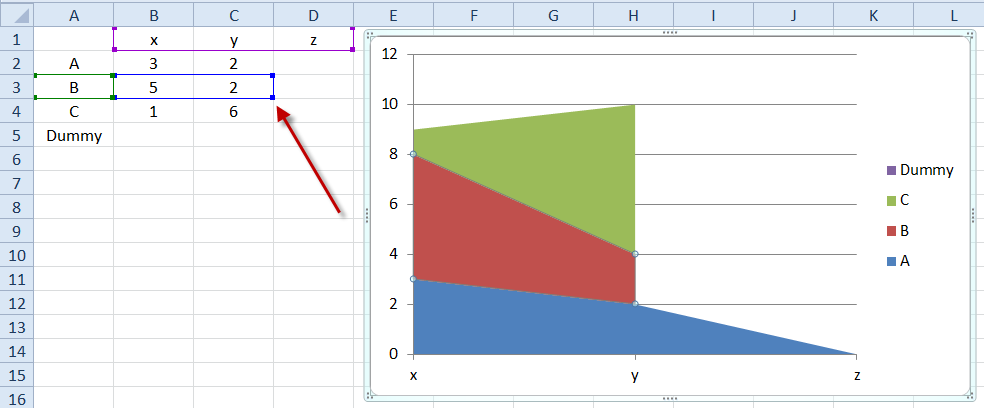
If you use the Standard Excel Area Chart with blank data, Excel will interpolate the blank as a Zero and your chart will look like this:
You can read how to fix this with your area charts here: How-to Make an Excel Area Chart Cliff (Fiscal Cliff Edition)
But, I recently saw a comment on my website asking how to do this with an Excel Stacked Area Chart.
It turns out that you can’t use the same fix for a regular area graph as the option is greyed out.
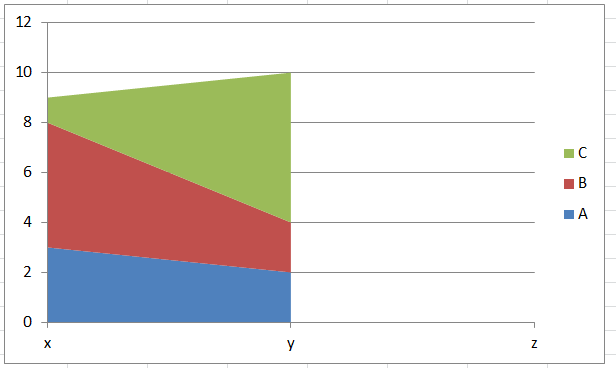
Below are the steps to create the following Stacked Area Chart in Excel 2007, Excel 2010 and Excel 2013.
The Breakdown
1) Setup Stacked Area Chart Data
2) Create Stacked Area Chart
3) Switch Rows / Columns in the Chart
4) Edit Chart Series Value Range
5) Delete Dummy Series Legend Entry
Step-by-Step Instructions
1) Setup Stacked Area Chart Data
In a regular Area Chart you do not need a dummy series, however, with a Stacked Area Chart, you will need an additional blank or zero value chart series.
In this example, we will set up our data like this with an additional series that we need to hold the empty Z series. Also, because the values of the Dummy series will be treated as zero, you won’t be able to see this series on the chart.
| x | Y | z | |
| A | 3 | 2 | |
| B | 5 | 2 | |
| C | 1 | 6 | |
| Dummy |
2) Create Stacked Area Chart
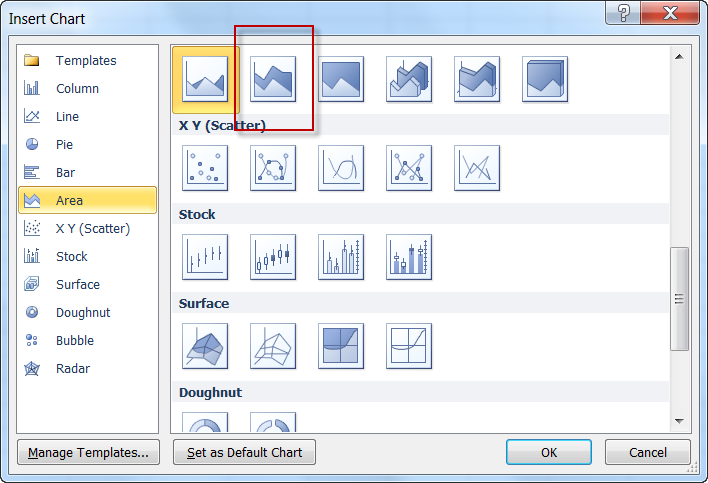
Now that we have our data set up, we will need to create our stacked area chart. To do this, select cells A1:D5 and then go to the Insert Ribbon and choose a Stacked Area Chart from the Chart Group and the Area Chart button:
Your chart will now look like this:
3) Switch Rows / Columns in the Chart
Because Excel decides how your data should be plotted, you will need to switch the rows/columns to reverse the Excel default. If you want to learn more about how Excel defaults your chart from columns to rows, check out this article:
Why Does Excel Switch Rows/Columns in My Chart?Why Does Excel Switch Rows/Columns in My Chart?
To switch the rows/columns, click on the chart and then click on Design Ribbon and then click on the Switch Row/Column button in the Data group.
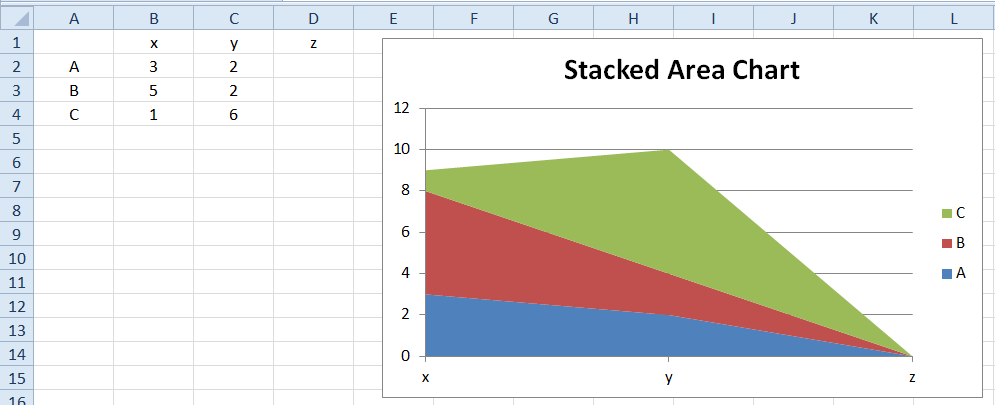
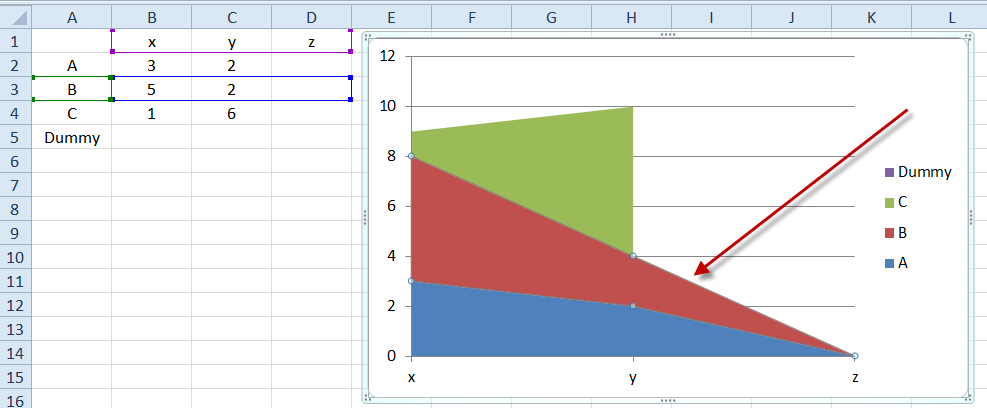
Your chart will now look like this:
4) Edit Chart Series Value Range
Besides the dummy series (which will stop Excel from hiding the Z category,) this step will create the cliff in the Stacked Area Chart. What we need to do is to reduce the size of the A, B and C series by one less column. You can do this in 2 ways.
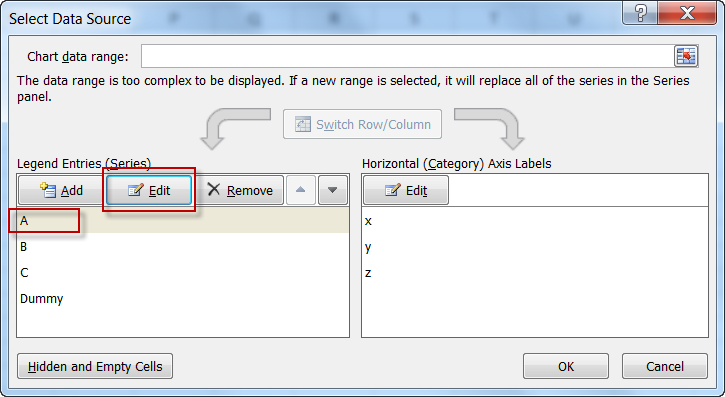
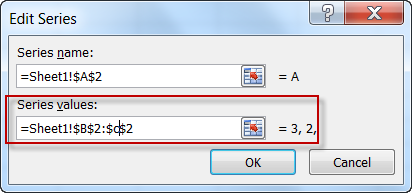
A) You can go to the Design Ribbon, click on Select Data button and then Edit each Legend Entry (Series) from ending on Column D (=Sheet1!$B$2:$D$2) to end on Column C (=Sheet1!$B$2:$C$2)
B) You can also edit each data series from the Worksheet by clicking on the chart, then select a single data series. Then you can adjust the series with the selection your mouse on the quick select controls.
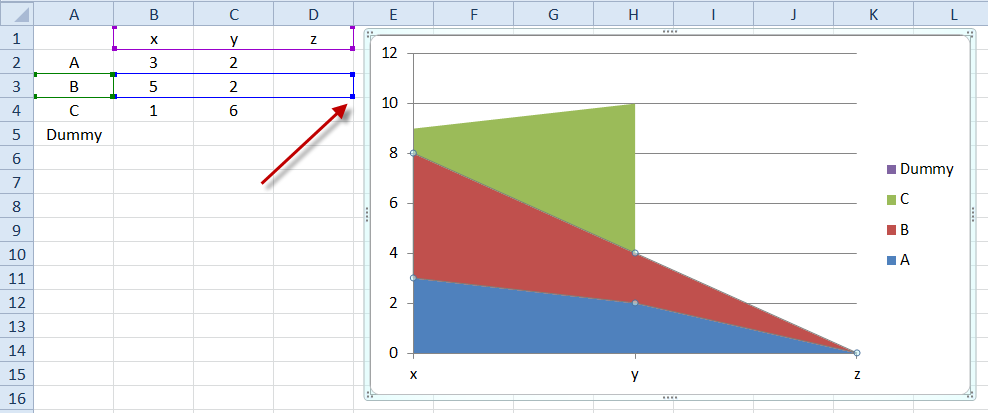
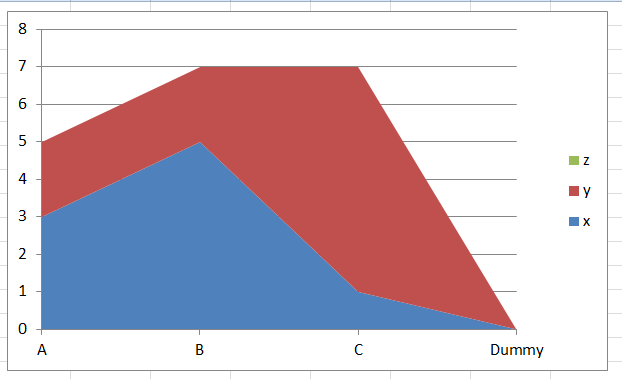
Your chart should now look like this:
5) Delete Dummy Series Legend Entry
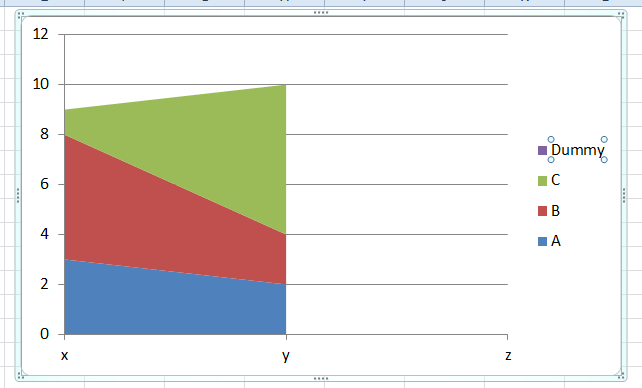
We just have a little chart clean up left. No one needs to know that we added a dummy (blank/zero) series to the chart. So to hide it, we need to remove the reference in the Chart Legend. To do this, simply click on the chart, then click on the legend and then click on the “Dummy” legend entry and finally, press your delete key.
Your final chart will now look like this:
Video Tutorial
Here is a How-to video demonstration of this Excel technique:

File Download
Here is a sample download file where you play with it yourself:
How-to-Make-an-Excel-Stacked-Area-Chart-Cliff.xlsx
Do you think that if a series is blank that it should be given a zero value? I don’t. I think we should still have the ability to choose with the Gaps option. Let me know your thoughts in the comments below.
Steve=True


