In a previous post “This is the Bomb: or How I came to love the Offset function” I showed you all about the Offset Formula. Understanding the Offset Formula is critical to understanding how to make a Dynamic Dashboard Chart in Excel.
Offset is a powerful formula that allows us to define a range in Excel based on criteria that we determine. In my last post I showed you how to tell Excel how to define the Offset Formula to create a new range. However, I did this by telling Excel exactly how to make the range. But what if I want Excel to tell me how to define the range? We can do that and I will show you how today!

For most Excel Dashboard Projects an administrator will enter in data and that data will most likely be in the same format. Typically the data is either entered in a Row or sometimes in a a Column, where the next data point is the bottom row or right most column. However, when you build a Dashboard Chart for this data, Excel doesn’t automatically add the new data point to the existing chart. Then the frustrated company administrator must go into the chart and add the new data points to each series the Dashboard Chart. What a pain!
This can be easily resolved with the Offset Formula to define the chart range and using an additional formula to determine how long or wide the series is NOW. And when we add new data points, Excel will automatically recalculate the series range (using the Offset Formula) and with this new range, Excel will add the new data points to series in our Dashboard Chart making the chart Dynamic. This will happen just by adding the new data points. If we set up all of our Excel Dashboard Templates this way, then it will save us tons of time. Your boss will think you spent hours adding the data points and reformatting the charts for the Executive Dashboard. Wouldn’t that be great?
For this to work, we will need a way to have Excel find the beginning and ending Chart series in the worksheet. If your data is in a row, we typically know the first data point of the chart, and we typically know the last data point. The starting data point usually doesn’t move, however, every hour, week, day, month, quarter or year we will want to add another data point and have the Dashboard Chart plot the updated series. This may not be a problem if you are doing this annually, but what if your Company Dashboard is done weekly or daily. Some Dashboards are hourly. There wouldn’t be enough time to add the data and change the chart series to make an hourly Dashboard feasible. However, with an Offset Formula and a way to find the Last Row or Last Column, we can make a hourly Dashboard Project very feasible.
My Big Break-thru
I never knew that you can define a range as an ENTIRE Column or an ENTIRE Row. I always thought you had to define a range like this =sum(A2:A190). What happens when you enter data in cell A191? Your formula will not have the correct total. Then I found out that you can also just reference the entire column like this: =sum(A:A). This will sum the from A1 to A1,000,000. Why didn’t I get this before now? This is going to be crucial in building our Dashboard Templates and in making our Charts and Graphs Dynamic!
Last Row or Last Column
So we now know how to use Offset Function and now we need to tell it how big to make our new range when new data points are added to the data series.
How do we do this?
We can use the Count Function for ranges of numbers or the CountA Function for ranges of text.
It can be as simple as Count(A:A) for how many rows are in the data series or Count(1:1) for how many columns are in the data series.
Changes to the Offset Formula
So lets add this to the Offset Formula and let Excel Dynamically define the data range.
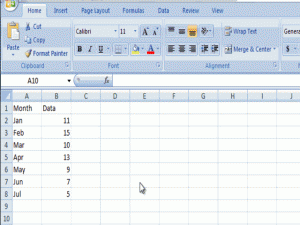
=OFFSET(B2,,,COUNT(B:B),)
This formula states the following:
Start at B2 and increase the range down the number of rows = count of entries in column B.
We will use this to tell Excel how long our Chart/graph range should be so that it makes a Dynamic Chart.
Hopefully you can now see the power in this formula. This is the foundation and it will become more apparent in my next post about building a Dynamic Chart using the Offset Function.
Free Sample File Download
Excel-Find-Last-Row-Sample-File.xlsx
Steve=True


