Data Transformation – Excel Array Solution
In a recent Friday Challenge, I asked our readers to transform an varying text string into dates and values to determine averages. Well although...
Friday Challenge – Data Transformation Solution
In the latest Friday Challenge, you were tasked with creating a Data Transformation Formula for the data listed on this page: Friday Challenge Data...
Friday Challenge – Data Transformation
This weekend starts the ModelOff competition.
"ModelOff is the world’s largest professional competition for Microsoft Excel, Financial Analysis, Investment Analysis and Financial Modelling." -Modeloff Site
If...
Advanced Excel Summation Skills – Using ARRAY Formulas to Check for Multiple Criteria
In this post, I will show you another Excel summation technique that you can use to evaluate criteria and then sum the data based on that...
How-to Make an Excel Single Image Goal Chart
Recently, a healthcare company employee contacted me about a chart he wanted to create. The company that he works for is trying to save...
How-to Make an Excel Stacked Column Pivot Chart with a Secondary Axis
In this previous post:
Stopping Excel Pivot Chart Columns from Overlapping When Moving Data Series to the Second Axis
I had a fan question - How...
How-to Setup Your Excel Data for a Stacked Column Chart with a Secondary Axis
Many users have mixed reactions about this secondary axis overlap fix. You can see the post here:
Stop Excel From Overlapping the Columns When Moving...
How-to Unprotect an Excel Worksheet If You Forgot the Passcode
Several years ago, I created an Excel workbook and I "Protected" a worksheet, but, I forgot the passcode the next day. Try and try,...
How-To Make a Dynamic Excel Scroll Bar Chart Part 2
Wow, it has been over 2 years. I am so sorry if you have been waiting all this time. Probably not, but I will finish...
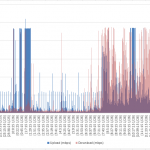
How-to Visualize 17000 Data Points of Upload and Download Times
In the last Friday Challenge, I presented you with 17,000+ data points representing 2 days of network data usage.
With so many data points, it...

