Practice Makes Perfect Excel Dashboards and Charts
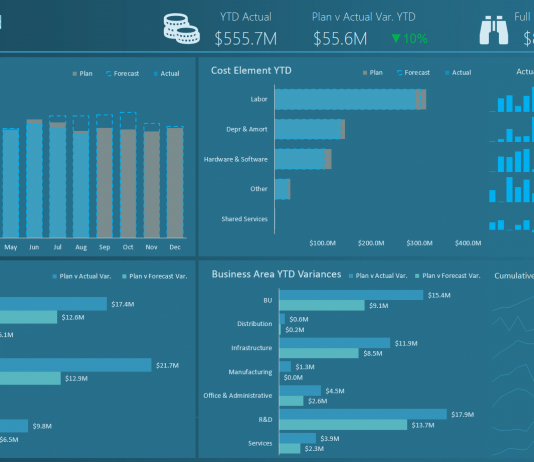
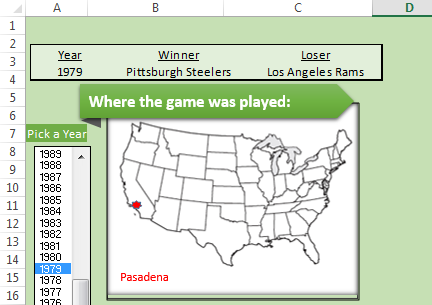
I would strongly recommend that if you want to get better at building Excel Dashboard Charts and Graphs that you should try and recreate...
How-to Make a Sales Pipeline Funnel Excel Chart Template
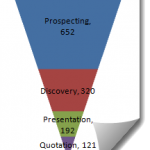
You probably have seen this type of Funnel Chart in Business Intelligence (BI) software packages and wondered how-to make this type of chart in...
How-to Make a Conditional Column Chart in Excel
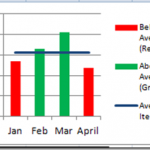
As you build your Microsoft Excel dashboards, you may want to highlight your data points that exceed your Key Performance Indicators (KPIs) as well...
How-to Copy Charts and Change References to New Worksheet
Have you ever made a great chart for your Excel Dashboard and you wanted to reuse it for another set of data? Perhaps you...
How-to Format Chart Axis for Thousands or Millions
Here is a great way to make your Dashboard Charts in Excel more appealing and your boss will love you and your friends will...
Dashboard Design Examples – Excel Chart X-Axis Grouping
When Designing an Excel Company Dashboard you will want to make sure that your audience can easily read and interpret the data.
Which do you...

