Has this ever happened to you?
You have sent your Excel Dashboard to your executive team or perhaps you have your spreadsheet on a shared drive. And then you get this call from your CEO who says:
“I accidentally deleted a row or column from your spreadsheet and now the dashboard charts are giving me this error:
A formula in this worksheet contains one or more invalid references.
Verify that your formulas contain a valid path, workbook, range name, and cell reference.“
As you can see, I have created a Stacked 2-D Column Chart in an Excel Spreadsheet based on the data on the left:
Now when I delete the Product 2 column of data from the spreadsheet it creates a pop-up error in Excel and you will continue to get this error every time that your chart recalculates:
This is what the Excel error dialog box looks like:
When you are making Excel Charts and Dashboards, you will find that this scenario happens all to often.
So how can you save your Excel users from themselves and also save your Excel charts and dashboards?
Here is a real easy way how to protect your worksheet without using the “Protect Worksheet” functions in Excel to save your data ranges for your charts.. I can’t remember exactly where I first saw this, it may have been from Mike Alexander.
First, lets learn a very little about Array Formulas:
Arrays Formulas and Array Constants:
Arrays are a complex formula operation that you can use in Excel. I suggest that you learn all that you can about Arrays because they will help you build your chard data ranges in ways that you never dreamed of doing. We will have many tutorials in the future on using array formulas to build your chart data.
We won’t be writing a very complex array formula/array constant in this tutorial, but we do need to know how to enter an array in an Excel spreadsheet.
Here is an example of an array formula. Notice the formula bar for cell A2:
Array formulas are surrounded by braces { } and are entered by pressing CTRL+SHIFT+ENTER upon entering the formula. Some people call this the CSE method. Microsoft Excel automatically inserts your array formulas between the braces { } and you do not enter them directly. Any formula can be entered by using the CSE (control+shift+enter) method. Also, you can create an entire Array range that is linked together by highlighting the range and pressing Control+Shift+Enter all at the same time. If you are confused, please check out the video tutorial that is at the bottom of this posting.
Saving Your Excel Dashboard Charts
Now you know how to enter an Array Formula / Array Constant in Excel, you may be asking, how that can save your Excel Dashboards and Excel Charts from your users?
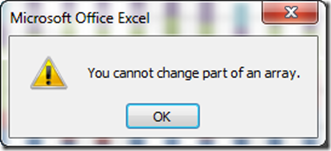
Here is how. Excel will NOT let you change any part of an array. So if we wrap our Excel Chart Data in an Array Constant or an Array Formula, we can can prevent our users from inserting or deleting any rows or columns in our chart data range. If the users attempt to insert or delete a column or row or cell in our chart data range, here is the error they will receive:
Taking our example from the first graphic in this article, you can see that I have wrapped the chart data in four different Array Constants. I did this by first highlighting the range (for example, B15:G15) and then typing in the following formula =4 and then pressing CRTL+SHIFT+ENTER. This will create an array formula that will keep our data range editable and also stop users from inserting or deleting rows or columns.
It may look a little funny now, but we can make it look cleaner by changing the text color in the Arrays to equal the background color (in this case yellow). Here is what it would look like after changing the text color to yellow:
Notice that cell H1 is not visible any more as it blends in with the background color yet it still maintains the functions of the Array Constant / Array Formula. Such that, when I try and insert or delete column D for product 2, I get an error and am prevented from doing so and thus changing the data range for my dashboard charts:
Now how is that for saving your Excel charts and dashboards from being changed by your executive team? And you don’t have to remember a passcode or send a passcode to anyone. They can still change the data, but it won’t have the same affect as deleting a column or row from your chart data range.
Video Tutorial
See this very easy but highly effective technique in this short video tutorial:
What other little known tips or tricks do you want to share? Let me know in the comments.
Steve=True


