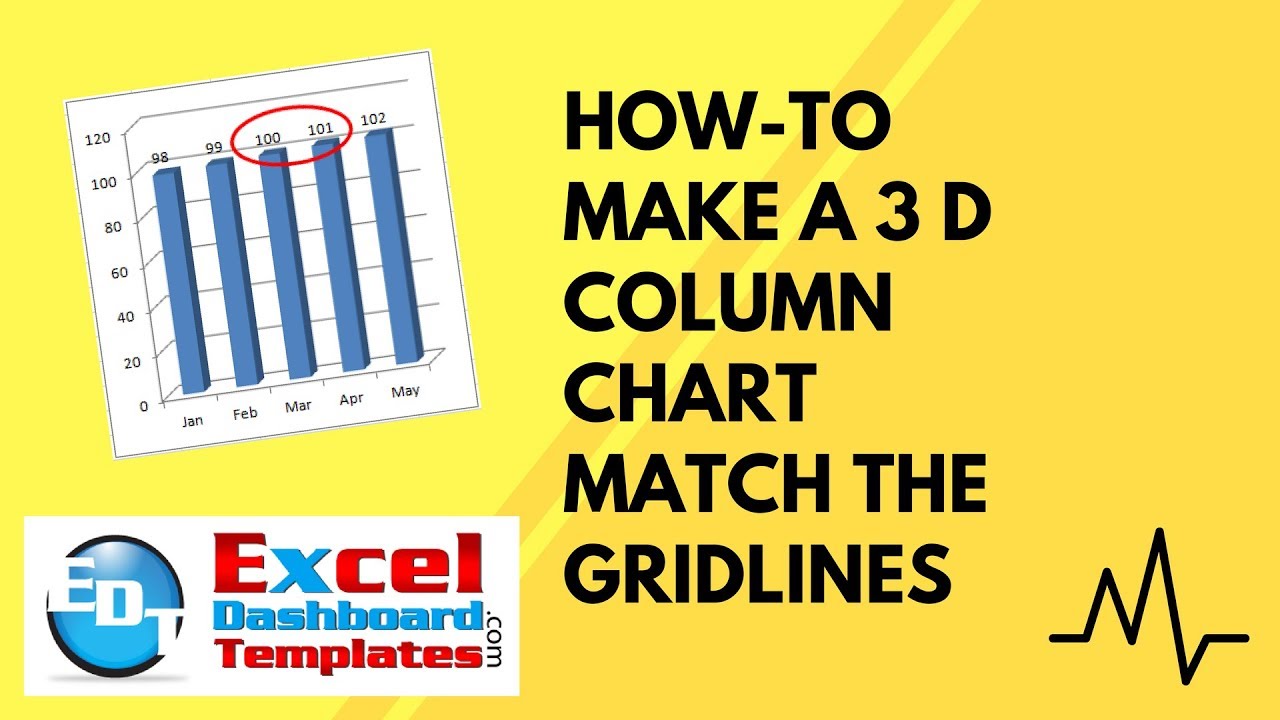
While working for a company that paid bonuses, the Financial and Human Resources team sent out a chart showing how close we are to reaching our goals for that bonus. However, you can see that the chart labels didn’t match the actual graph that was charted in Excel.  This is a common problem with 3D charts in Excel. And there is an easy fix to this Excel problem. If the staff had not put the percentages on the chart, I would have thought that in March that we missed the target.
So what is going on here?
The main problem is that Excel 3-D charts and graphs will add an extra dimension that is causing this Excel 3D problem. It seem that when Excel adds the 3rd dimension, it adds a depth to the chart and that depth is defaulted from No Gap to a Medium Gap and this is the problem. Lets check it out with this Step by Step tutorial. Following the Step-by-Step, you will see an additional way to fix this problem and also, there is a free Video tutorial at the bottom of this post.
Step-by-Step
1) Create your 3D Chart by highlighting the data range, going to your Insert Ribbon and choosing a 2-D Clustered Column Chart from the Chart Group.

Your 3D chart will now look like this in Excel:
2) Now lets show the Data labels for each of the columns in the 3-D Excel Chart. Do this by clicking on your chart, then select the Layout ribbon, and choose Data Labels from the Labels Group and choose Show.
Here is what your chart will look like:
3) Now lets fix the problem – First Right Click on the Data Series in the Excel Chart and choose “Format Data Series…” from the Excel Pop-up Menu.
Now when the Excel Dialog Box you want to change the Gap Depth to No Gap in the Excel Series Options section.
Your Excel 3D Chart has now been fixed and your columns will now match the major horizontal gridlines.
3D Excel Chart Solution #2
This is a very easy fix to this 3-D Excel Chart Column/Grid line problem. Just use a 2D column chart in Excel. ![]() Sorry to bring this up, but there are many problems that occur with 3D charts. Depth is one of them. You will see that the 2D chart column does not have this problem let alone other problems.
Sorry to bring this up, but there are many problems that occur with 3D charts. Depth is one of them. You will see that the 2D chart column does not have this problem let alone other problems.
Video Tutorial:
Thanks for visiting my blog.
Does your company use and love 3D charts? Leave me a comment.
Steve=True


