In a previous post, and one of my favorites, I showed you a unique company goal chart using a beer mug instead of a thermometer. Click this link for the step-by-step tutorial, file download and video demonstration here:
How-to Make a Beer Mug Goal Chart as an Excel Dashboard Component
Related to the that article, I have had a few comments from people that said they can’t use the goal chart at their company because of the beer theme. One of our readers asked if we could create one with a soda bottle.
Well this is not an easy task because of the neck on the soda bottle.
But then Peter went and dazzled me by creating one.
Here is what it looks like at 86%:
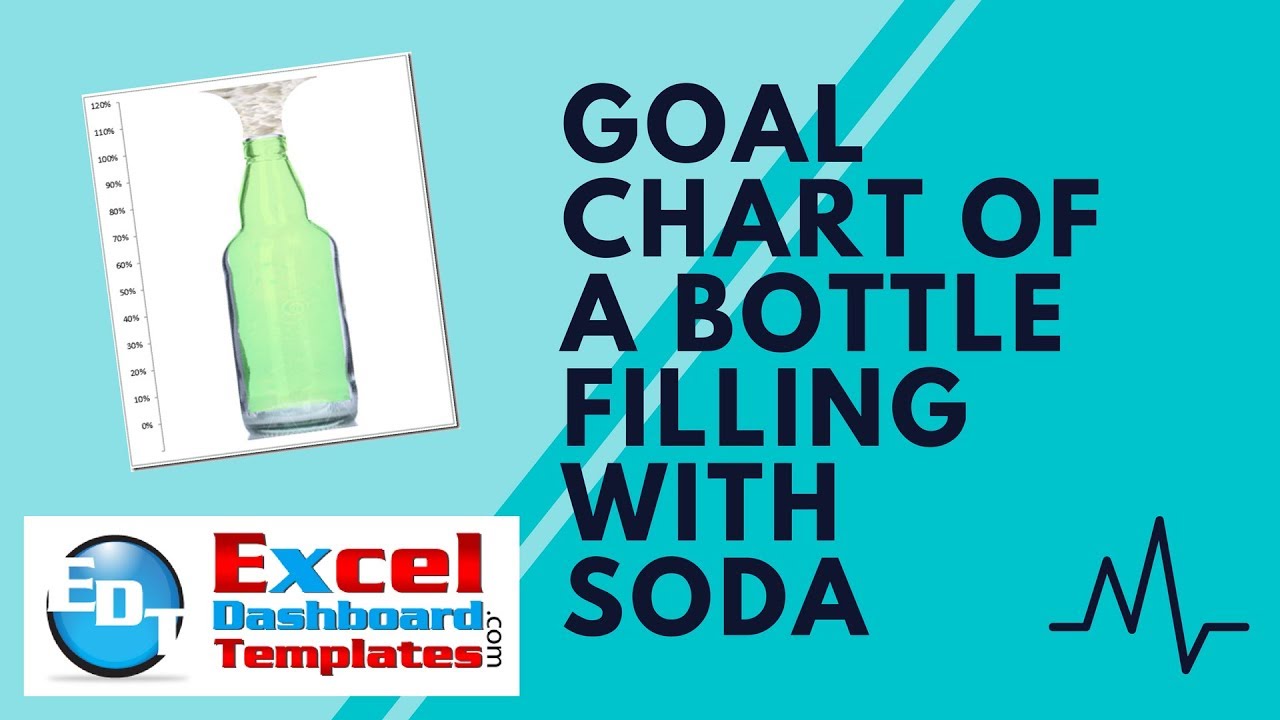
He even puts in foam when you go over 100%.
Here is what it looks like when we change the chart to 120%:
How cool is this!!!! Peter is so awesome. Great job Peter!
So how did he get it to follow the contours of the bottle neck for the Excel Goal Graph?
To learn that, you should check out the video:
Also, if you want to play with the Free Sample Excel Template file, you can download it here:
Excel-Goal-Chart-with-a-Bottle-filled-with-Soda.xlsx
Thanks again Peter! You ROCK!
Steve=True


