Tag: Challenge
Advanced Excel Summation Skills Using SUMIFS and SUMPRODUCT
In this post, I will show you 2 other techniques that you can use to evaluate criteria and then create a sum of data...
Advanced Excel Summation Techniques Using Pivot Table
There are many ways to Sum data in Excel. But when you have lots and lots of data, then you will want to learn...
Friday Challenge – Advanced Excel Summation Skills
This is a fun skills challenge to make sure you are well rounded. What is the SUM of your Excel Game? You will find...
Friday Challenge – Find Unique Class List in Excel ANSWER
On Friday, I posted this challenge:
https://www.exceldashboardtemplates.com/friday-challenge-find-unique-list-in-excel/
You can download the sample data set here: Challenge Sample Data
Check out the post and download / try it yourself before you...
Friday Challenge – Find Unique List in Excel
It is time for another Friday Challenge. This is based on actual scenario from a recent project.
A user had a large list of values in...
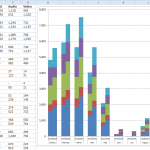
Friday Challenge Answers: Year over Year Chart Comparisons
Thanks for the submissions for the Friday Challenge.
You can get the sample data and chart request here: friday-challenge-help-new-to-excel-yoy-comparisons
Here are some other submissions:
A) In the...
Friday Challenge: Help! New to Excel! YOY Comparisons
Luckily I was able to help this user, but I think that we can even do more. Here was the original request:
"Help Please! I’m...
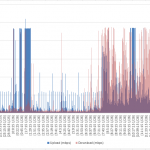
How-to Visualize 17000 Data Points of Upload and Download Times
In the last Friday Challenge, I presented you with 17,000+ data points representing 2 days of network data usage.
With so many data points, it...
Friday Challenge: What Charts Would You Make?
This Friday Challenge involves Network Data Usage. You will find over 17,000 data points representing 2 days of network data usage in the linked file.
With...
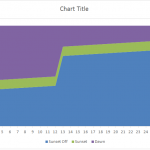
Excel Stacked Area Time Chart – Friday Challenge Answer
In our recent Friday Challenge, a user asked this:
"This is a scatter with smooth line and markers graph. What I would like to have...


