As a project manager or business analyst, we are often called upon to create dashboard type views in status reports for Executives.
Typically, company executives don’t want to see lots of words, they just want a table and a quick visual of progress.
Also, most status reports are created and displayed in PowerPoint.
Now comes our problem:
1) You create your status report in a basic table in PowerPoint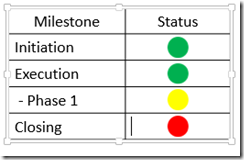 2) You insert shapes into the table cells that represent your status colors like Green for Good, Yellow for Cautious and Red for in trouble.
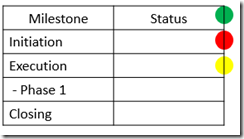 3) Then you realize that your table looks better on the the left side of the PowerPoint slide deck. And…as you move your table to the left, you notice that your table is moving but the status colors are not 🙁
So what can we do to lock in the shapes in a PowerPoint cell?
Here is one way to do this:
Step-by-Step 1) Insert/Create your table in PowerPoint 2) Insert your shapes in to any PowerPoint Slide from the Insert Ribbon
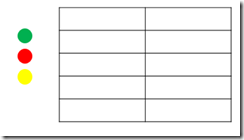 3) Select your shape and Press CTRL+C to copy the shape or Right Click and select Copy
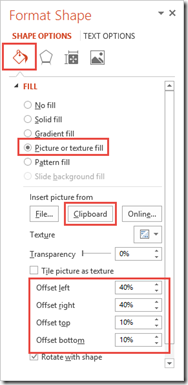
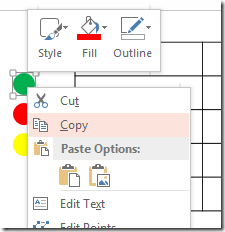 4) Right Click on the desired table cell and select “Format Shape”
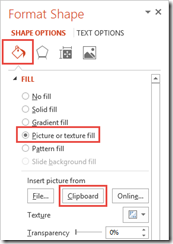
 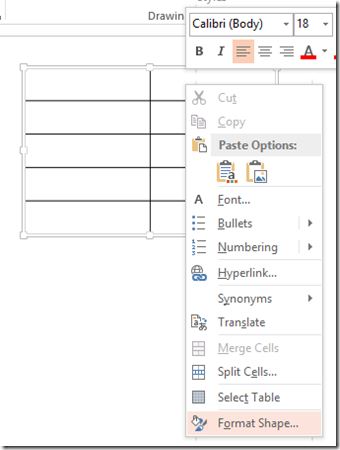 5) From the Format Shape Fill section,
a) Choose Picture or Texture Fill
b) Press Clipboard to Insert your Shape in the Table Cell
6) Adjust the Offsets until your shape lo When your shape is inserted, it will fill up the entire cell. 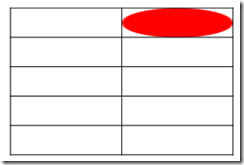 We need to add some spacing around the shape to make sure it looks normal. You can do this by increasing the Offset values in the Fill pop-up menu.
 You have now inserted a shape that is connected to a table cell in PowerPoint.
 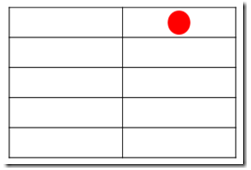 This will save you tons of time as you format and change your presentation. To change status colors to one of the other status’, you just need to copy the original shape you inserted again and format the cell of the table like you did before.
Don’t you wish PowerPoint was more like Excel? 🙂
Video Demonstration Here you can watch the step-by-step process first hand: Watch the original video tutorial
File Download Here you can see the final result and play with it yourself. PowerPointShapeInsertedintoTableCell.pptx
Do you have to use PowerPoint a lot in your position? I find that I have to use a combination of Microsoft Excel, Word, PowerPoint, Project and Visio in that order. Let me know the tools that you use in the comments below.
Steve=True
Reader discussion
Comments preserved from the original page. New comments are closed.
Reader
In this specific case of using traffic lights, I found a much easier alternative. Just insert a filled circle Symbol (Insert –> Symbols –> Symbol) into the desired cell and colour it. It will always stay the same shape, even if you resize the cell, and is easy to move. To edit its size, just change the font size.
Hope this helps 😉
Reader
When using the authors method described, any background cell colour is lost – it goes white
Reader
Seems strange. What version were you using? It worked in my video 🙂
Reader
Thank you for this tutorial. I used it and its awesome
Reader
You are welcome. Glad you liked it.
Reader
This method seems to work. But the background color is lost. Do you know how to retain it? Thanks.
Reader
Hi Hema, I believe if you have the background color on cell on top and bottom, it should be maintained.