Tag: NA() Function
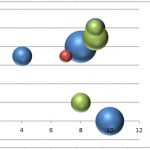
Dynamically Change Excel Bubble Chart Colors
In last week’s Challenge, I posted a question from an Excel User Forum that asked the following:
“I've used Excel 2010 to create a bubble...
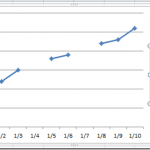
How-to Show Gaps in a Line Chart When Using the Excel NA() Function
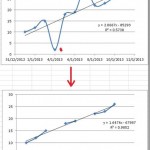
In last Friday’s challenge, we had a Excel Analyst that needed to remove outliers from his Excel Line Chart. In essence, he wanted to...
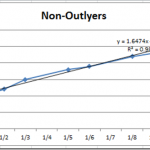
How-to Eliminate Statistical Outliers in an Excel Line Chart
Okay, I posted this Excel Chart Challenge on Friday. How did you do? I am sure your solution is better than mine. This was...
Friday Challenge – Eliminating outliers in and Excel Chart
Okay, apologies again . I have been so swamped with my Go-Live project this week that I have been too tired to finish the...
Halloween Special – Spider Web, Spider and the Fly Chart
In honor of Halloween I thought I would post something fun. For those that are not in the USA, Halloween is where children dress...

