Tag: How Would You
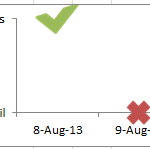
How-to Make a Pass Fail Chart in Excel
Last week, I posed a Friday Challenge that was posted in a Q&A for Excel. Here it is:
*****************************************************************
Plotting a line graph to track build...
Friday Excel Challenge Submissions–Which Chart Solution One Do You Like Best?
Sorry for the late posting. I was in Atlanta all week working on a new project and going out with the client at night,...
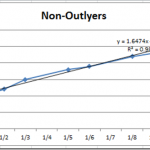
How-to Eliminate Statistical Outliers in an Excel Line Chart
Okay, I posted this Excel Chart Challenge on Friday. How did you do? I am sure your solution is better than mine. This was...
Friday Challenge Answer – Create a Percentage (%) and Value Label within 100% Stacked...
Last week I posted a Friday Excel Challenge!. Fun times. How did you do? Spoiler alert, if you don’t know how to create this...
Multi-Column Stacked Chart – How would you do it? – How I did it.
First, I want to say thank you, because you are an Excel fan. Then again, maybe you are an Excel Geek? I know I...
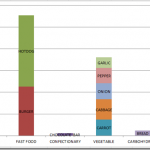
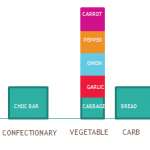
Stacked bar chart with data from multiple columns – How would you do it?
Hello everyone! Thanks for being a fan. I am such a fan of Excel, that meeting MrExcel this week threw me off my schedule. ...

