Tag: 2010
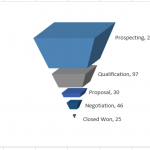
How-to Make a Cool Looking 3-D Sales Funnel or 3D Sales Pipeline Chart in...
Some times these types of charts are called funnel charts or some times they are called pipeline charts. Regardless of what you call them,...
How-to Make an Excel Area Chart Cliff (Fiscal Cliff Edition)
So all the US news agencies keep talking about the Fiscal Cliff. This reminded me of a problem that many people have when making...
How-to Select Data Series in an Excel Chart when they are Un-selectable?
When I first learned to make Excel charts, I was taught to select the chart and then select the data series with my mouse. ...


