So the summer Olympics start this week. So I thought it would be a good time to visit how one might create an Olympic Medal Count Dashboard using Microsoft Excel.
How would you create your own Olymipic Medal Count Dashboard?
The first thing I would do is to see what type of data I can gather that will help me design this dashboard for the Olympics.
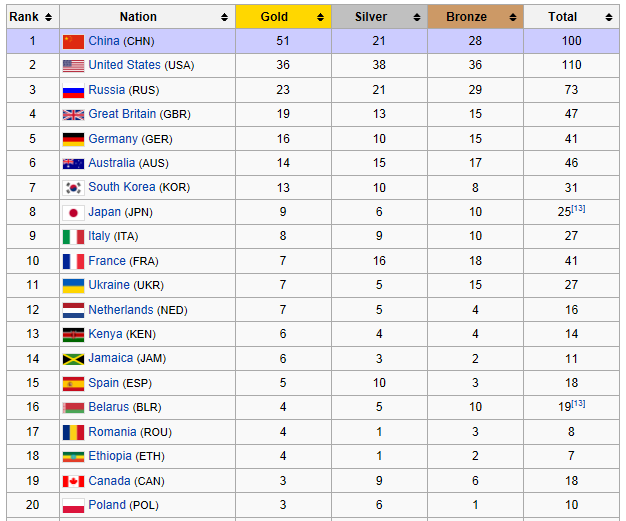
So I go to the ever fast Google and type in Olympic Medals and I see this Wikipedia url:
http://en.wikipedia.org/wiki/2008_Summer_Olympics_medal_table
On this link, you will find the data table by country sorted by gold medals first then total medals earned in the 2008 Summer Olympics.
This is just what we are looking for and it will help us build our Excel Dashboard.
In my dashboard, I am going to limit my Dashboard Real Estate to the visible screen on my computer which isn’t very much, so I will have to be very selective on the data I wish to display.
So that is the next step you need to take as well.
Study the data. Load it into Excel. Run a few calculations and then come up with your Dashboard Design.
I suggest taking a piece of paper and sketching out your design before you begin your final dashboard development.
In the next post, I will sit down with a piece of paper and create my dashboard design. Our Excel Dashboard would be compiled of a number of dashboard components. These components may include graphs and tables.
In the comments, let me know what you types of Dashboard Component charts, graphs and tables would you include?
What patterns of data do you want to display in your dashboard and what messages do you want to get across to the reader?
Let me know.
Steve=True


