Tag: 2013
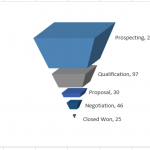
How-to Make a Cool Looking 3-D Sales Funnel or 3D Sales Pipeline Chart in...
Some times these types of charts are called funnel charts or some times they are called pipeline charts. Regardless of what you call them,...
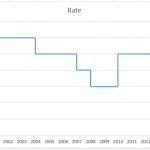
How-to Easily Create a Step Chart in Excel
You might be asking yourself, “What is a Step Chart?”
You have probably seen one, but didn’t know that it is called a step chart.
Here...
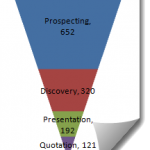
Where Did My Excel 2013 Pyramid Charts Go? (Or How-to Make a Sales Pipeline...
In a previous post I showed you how to make an Excel Sales Funnel Chart or Sales Pipeline Chart, but it is a little...


