In past versions of Excel, the default was that your new chart was put into a chart sheet.
You can learn more about chart sheets here:
What is an Excel chart sheet vs. an embedded chart?
But Excel Chart Sheets are not very flexible. For instance, I thought that you could only put one chart in a chart sheet. But it turns out that it is not the case.
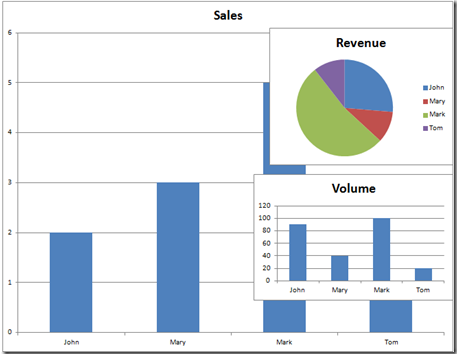
However, there is a trick to get it to work. The trick is that if you create a chart in a chart sheet, Excel will only allow you one chart in the chart. In the picture below, you will see that when I moved several charts to a chart sheet, they all insert as objects within the original chart on the chart sheet.
You can learn more about moving charts to and from chart sheets here:
How-to Get Your Excel Chart from Embedded to a Chart Sheet
So you must start with a blank chart sheet. Below is the detailed step-by-step tutorial. I stumbled across this technique from the great John Walkenbach, Excel MVP.
The Breakdown
1) Create Blank Chart Sheet
2) Create Embedded Charts
3) Move Embedded Charts to Chart Sheet
Step-by-Step
1) Create Blank Chart Sheet
This is the key to having multiple independent charts within a single Excel Chart Sheet. You cannot start with a chart sheet that was created for a chart. It must be blank. The best way to ensure that you are creating a blank chart sheet in Excel is to select a blank cell surrounded by blank cells on any worksheet. If the cell is adjacent to non-blank cells, then Excel may try and use that data to create a chart in the chart sheet.
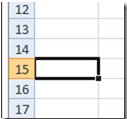
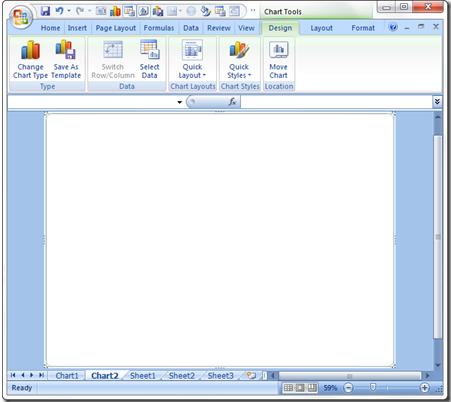
Now that you have chosen a blank worksheet cell surrounded by blank cells, then you can create a blank chart sheet by pressing your F11 key.
2) Create Embedded Charts
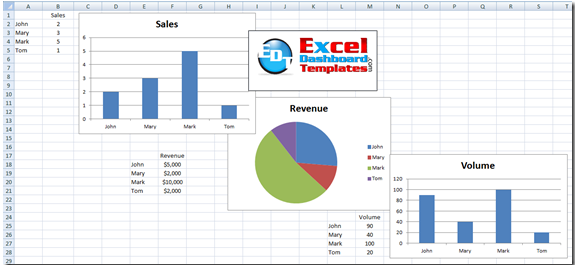
Now go back to your regular worksheet and create your regular embedded charts/graphs.
3) Move Embedded Charts to Chart Sheet
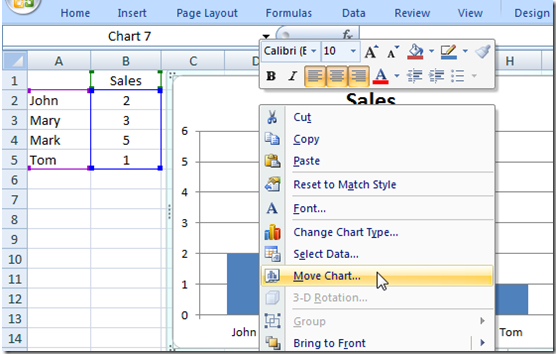
Now to move your embedded charts into the standalone chart sheet, you can right click on any of the embedded charts and select the “Move Chart…” option from the pop-up menu.
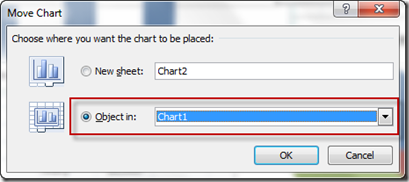
Then you will get the Move Chart dialog box. Here you want to choose the Object In radio button and then pick your chart sheet from the picklist.
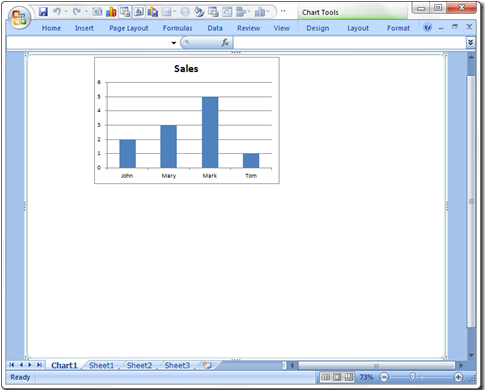
You will now see your chart has been moved to the chart sheet, but it is not filling up the entire chart sheet, so it is an independent object.
If you repeat this step for your additional charts, your additional charts will also be independent and chart sheet will look like this:
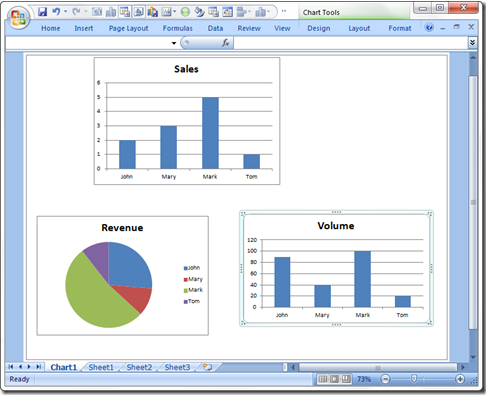
By starting with a blank chart sheet, you are able to move multiple charts to that chart sheet. Then can then be independently moved and sized to your hearts desire.
Video Demonstration
Sample Excel File
I never knew you could do that with a chart sheet. I always thought it was one chart sheet for one chart. Did you know about chart sheets or that you could move multiple charts to a chart sheet?
Steve=True


