A newer Excel Chart creator had this question:
“This is a scatter with smooth line and markers graph. What I would like to have displayed, is everything above the blue line one colour, between the blue and green line another colour, and between the green line and the base a final third colour.
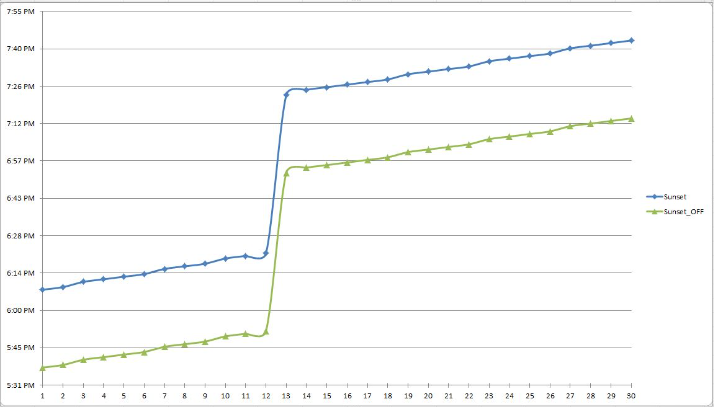
Is this possible with the graph style I chose? If so, how? Perhaps there is a more appropriate graph? (I like the smooth line)”
– Ark, Ontario, Canada
How would you recommend the user create the chart that they are looking to do?
Requirements:
a) Vertical Axis must start and end at the times 5:31PM and 7:55PM
b) From the Horizontal Axis to the Green Line should be one color
c) From the Green Line to the Blue Line should be one color
d) From the Blue Line to the top of the chart at 7:55PM should be one color
e) Start with this as your Sunset and Sunset Off Data Series:
You should just be able to copy and paste the data directly into a blank Excel Workbook.
| A | B | C | |
|---|---|---|---|
| 1 | Sunset Off | Sunset | |
| 2 | 1 | 5:35 PM | 5:55 PM |
| 3 | 2 | 5:36 PM | 5:56 PM |
| 4 | 3 | 5:37 PM | 5:57 PM |
| 5 | 4 | 5:38 PM | 5:58 PM |
| 6 | 5 | 5:39 PM | 5:59 PM |
| 7 | 6 | 5:40 PM | 6:00 PM |
| 8 | 7 | 5:41 PM | 6:01 PM |
| 9 | 8 | 5:42 PM | 6:02 PM |
| 10 | 9 | 5:43 PM | 6:03 PM |
| 11 | 10 | 5:44 PM | 6:04 PM |
| 12 | 11 | 5:45 PM | 6:05 PM |
| 13 | 12 | 5:46 PM | 6:06 PM |
| 14 | 13 | 6:50 PM | 7:10 PM |
| 15 | 14 | 6:51 PM | 7:11 PM |
| 16 | 15 | 6:52 PM | 7:12 PM |
| 17 | 16 | 6:53 PM | 7:13 PM |
| 18 | 17 | 6:54 PM | 7:14 PM |
| 19 | 18 | 6:55 PM | 7:15 PM |
| 20 | 19 | 6:56 PM | 7:16 PM |
| 21 | 20 | 6:57 PM | 7:17 PM |
| 22 | 21 | 6:58 PM | 7:18 PM |
| 23 | 22 | 6:59 PM | 7:19 PM |
| 24 | 23 | 7:00 PM | 7:20 PM |
| 25 | 24 | 7:01 PM | 7:21 PM |
| 26 | 25 | 7:02 PM | 7:22 PM |
| 27 | 26 | 7:03 PM | 7:23 PM |
| 28 | 27 | 7:04 PM | 7:24 PM |
| 29 | 28 | 7:05 PM | 7:25 PM |
| 30 | 29 | 7:06 PM | 7:26 PM |
| 31 | 30 | 7:07 PM | 7:27 PM |
Sheet1
Can you solve this request? Leave me how you would create the chart in the comments below or drop me a comment with your email address if you want to send in your solution.
Good luck! But you don’t need luck as you are sure to complete this one quickly.
Steve=True


